
In the previous parts of this four-part blog series, we identified the top 10 performance tips that are sure to help your Power BI solutions consume fewer resources, work faster and offer a better reporting experience to your report consumers. If you haven’t already, be sure to check them out through the below links.
This blog series will highlight the top 10 tips for performance and best-practice. Each blog will be broken down into the following parts:
- Top 10 Power BI Performance Tips (Part 1)
- Top 10 Power BI Performance Tips (Part 2)
- Top 10 Power BI Best-Practice Tips (Part 3)
- Top 10 Power BI Best-Practice Tips (Part 4)
Now that we have the factor of performance under control through all the previous tips, it’s time to go through the top 10 best-practice tips for Power BI.
Ensuring our Power BI solutions are aligned as closely as possible to best-practice means reducing the risk of errors occurring, building easily manageable solutions and solutions that are correct on the first attempt, implementing solutions that are user friendly and remove ambiguity, as well as building Power BI solutions that are scalable for the long term.
So, let’s kick off Part 3 with the top 5 best-practice tips.
Tip 1) Use Explicit Measures, not Implicit Measures
Simply put, implicit measures are measures that are automatically assigned an aggregation such as a Sum or a Count by Power BI. When we ingest data into Power BI all the numerical columns that can be summarised are implicit measures by default. We should convert all these implicit measures to explicit measures. First, let’s make sure we all understand what an implicit measure is by the below example.
What is an Implicit Measure?
We enter Power BI Desktop to start creating an insightful, actionable, really cool report. So, the first thing we should do is ingest data into Power BI. Once we do this, we will find all the tables we ingested in the Fields pane, as the below shows.
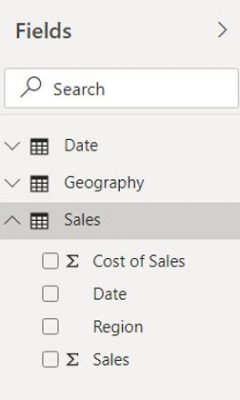
In the Fields pane, we have one fact table called Sales and the two dimension (lookup) tables, Date, and Geography. In the Sales table, we have all the columns we ingested from the data source, and notice we have the SIGMA (∑) symbol next to Sales and Cost of Sales. This means these measures are numerical columns that can be summarised; therefore we can use for arithmetic calculations. These are what we refer to as implicit measures. But why are these implicit measures? Well, let’s go ahead and drag and drop the ‘Sales’ attribute onto the canvas and click the drop-down arrow for the Sales column in the values section, as the below illustrates:
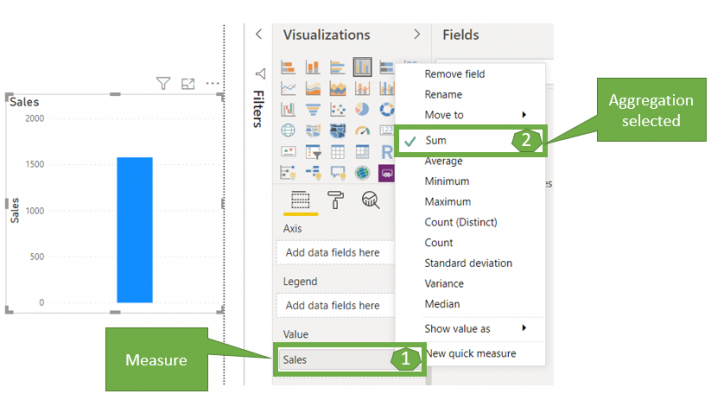
Notice from the above image, the Sales measure is automatically assigned the Sum aggregator, which can be changed to Average, Maximum, Count, etc. This is why we refer to these as implicit measures, as we did not directly state the type of aggregation assigned, but instead Power BI selected it by default.
Why should we convert Implicit to Explicit Measures?
Even though on this occasion, the aggregation for Sales is correct, it’s possible on the next occasion it displays as a Count. This can lead to confusion for the report author and result in report consumers reporting on incorrect numbers. Also, if your report consumers are using the Analyse in Excel feature, implicit measures cannot be placed in the values section. Furthermore, we cannot reference implicit measures within other measures and the name of an implicit measure is not always self-explanatory. All these reasons are why we should explicitly state the aggregation to be used, by converting all implicit measures to explicit measures.
How should we convert Implicit to Explicit Measures?
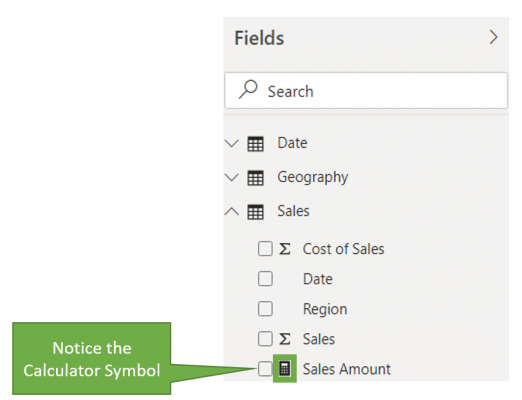
To do this, we simply have to create a measure with the aggregation pre-defined, as the below illustrates:
Sales Amount = SUM ( Sales[Sales])
Once we create this measure, notice that we have a CALCULATOR and not the SIGMA symbol against the measure ‘Sales Amount’:
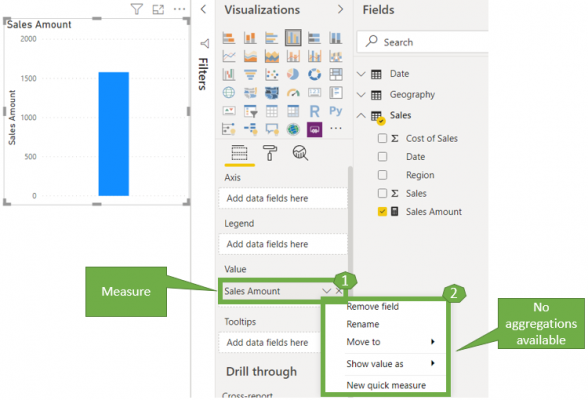
So, if we now drag and drop the explicit measure ‘Sales Amount’ onto the canvas, notice that we get the same result as the implicit measure, but we cannot select an aggregator for this measure any longer.
Tip 2) Organise Measures by Grouping
Tip number two goes hand in hand with the tip explained above, as after we generate explicit measures, what should we do with all those leftover implicit measures? Surely they will confuse the report authors if they are left visible. Furthermore, if we structure our data model as a Star Schema, every fact table will contain some foreign keys to establish a relationship with the primary key in the dimension (lookup) table. Should these columns remain visible for everyone to use?
In Power BI, we can easily group measures and columns into folders, therefore allowing us to keep a tidy solution and only display to the report authors the measures and columns that should be used in reporting. The below image shows all the fields available in our Power BI solution, before and after they have been grouped.
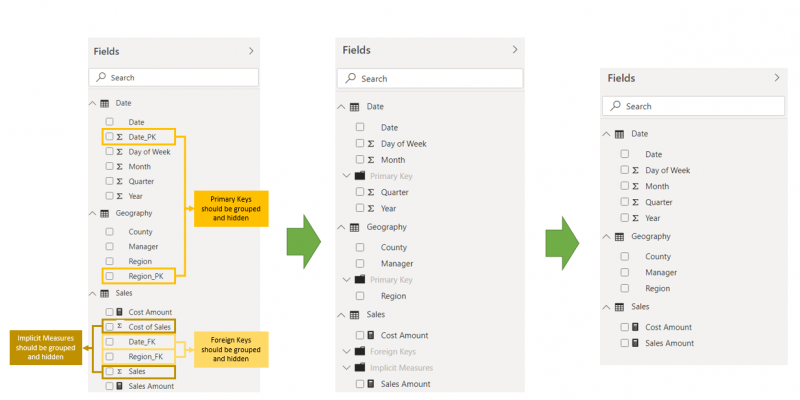
The general standard that we should follow for all Fact and Dimension tables is:
Every Dimension table should contain one folder:
- Primary Keys: All the PK’s in the Dimension (lookup) table should be placed here and hidden.
Every Fact table should contain two folders:
- Foreign Keys: All the FK’s in the Fact (Data) table should be placed here and hidden.
- Implicit Measures: All measures imported from the source should be placed here and hidden.
Tip 3) Use the correct Connectivity Type
Choosing the right connectivity type early on in your Power BI development process is important, as this influences:
- Performance
- Resource usage
- Capabilities
Furthermore, once a connectivity type has been selected, you cannot convert it to another, unless you are converting a DirectQuery to an Import, therefore making the right decision from the beginning can save you some time.
Now, we will not deep dive into the detail of the various connectivity types in this blog, as I have already written about it in a previous blog which you can find here. However, we will briefly explain the questions we should be asking ourselves, to determine which connectivity type is the most suitable. Please keep in mind, this is only a guide, and depending on the business context and reporting requirements, it can change.
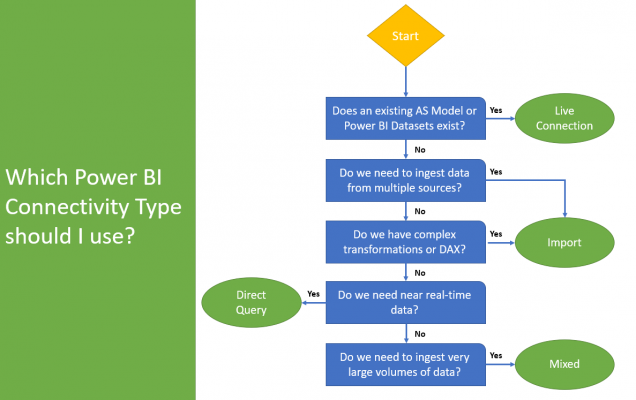
Does an existing AS Model or Power BI Dataset exist?
We should take advantage of an already existing Analysis Services Model or Power BI Dataset that contains all the data we would require for reporting. Why should we redo all the work, when time and resource has already been put against it. Furthermore, in an enterprise scenario it is recommended to have a source that acts as a single version of the truth for all reporting.
Do we need to ingest data from multiple sources?
Previously, if we required to ingest data from multiple different sources an Import connectivity type was the only option, but since composite models came into play this is no longer the case, as we can use a Mixed connectivity type. With that said, if you simply need to ingest data from multiple sources and have no other restraints or requirements, Import would still be the way to go.
Do we have complex transformations or DAX?
Some restrictions in capabilities exist depending on the connectivity type selected. For this reason, if we require complex transformations or DAX for incorporating some business logic into our Power BI solution, we should use an Import as the full capabilities of Power BI are available.
Do we need near real-time data?
If we need our data to be near real-time, therefore refreshed as of when the report consumers interact with the report, DirectQuery is the way to go. DirectQuery establishes a connection to the underlying data source, therefore every time a user interacts with a visual in Power BI, a query is generated, sent to the underlying data source, and returns the data to be rendered. This is the opposite behavior from an Import connectivity type, which is sometimes referred to as a scheduled connectivity type, as it requires a refresh to be scheduled before the data is updated.
Do we need to ingest very large volumes of data?
In the past, we couldn’t handle very large datasets, even with Premium removing the 1GB restriction that comes with Power BI Pro licensing. When composite models were introduced to Power BI, this came with the mixed connectivity type, which unlocked new volumes of data that can be ingested into Power BI. For this reason, if you have very large fact tables, you can have these set to DirectQuery and all your dimension (lookup) tables can be set to import, hence a mixed connectivity type.
Tip 4) Use an About Page
Our Power BI reports can be designed in a way that aligns them to best-practice for data visualisation. However, one other element we should aim to incorporate is an about page. This would offer the report consumers a high-level overview of the purpose of the report as well as the answers to the common questions that would usually be raised with the BI team.
Hold up, if you designed and developed the report well, is this needed?
Yes! You could have followed the correct process from the beginning, in running requirement gathering workshops, identifying the right audience, deriving actionable KPI’s and creating Power BI reports that are both aesthetically pleasing and actionable, but the about page offers instant insight and understanding in what the Power BI report will showcase.
The information that we can add to an about page is the following:
- Purpose and description of the Power BI report
- Owner of the Power BI report
- Link to a data dictionary that offers the definitions/terms
- Last Refresh and Refresh Frequency
- A section that highlights how to use various capabilities
So, what are the benefits?
Let’s not forget that it is very common for the audience of the Power BI report to sometimes need a refresher on the core concepts. Furthermore, new people will be joining the organisation and having an about page acts as a quick starter guide. It also eases some pressure of the BI team, as it answers the common questions and it can remove any ambiguity in the definitions of various measures and descriptive attributes used in the report.
Tip 5) Rename & Reduce Transformation Steps
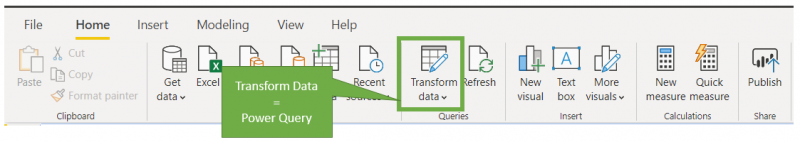
Transforming data in Power BI is done through the Power Query component, which is used for all data transformation and data shaping operations. For those who may be new to Power BI, Power Query is easily accessible by simply selecting the ‘Transform Data’ button in the Power BI Desktop ribbon, as the below illustrates:
Now, when working with large PBIX files that have more complex business logic, the list of transformation steps tend to be much longer. When working with Power BI, common practice would be to assign self-explanatory names to each step and remove any redundant steps that can be merged together. This offers an instant understanding of each step at a glance and reduces confusion.
What are Transformation Steps?
This is simply a list of transformations that have been applied in the Power BI solution, which are displayed in the right-hand panel named ‘Applied Steps’. This is a great feature of Power BI that allows us to easily understand all transformations applied, refer to previous transformations applied, and to easily revert.
Rename the Transformation Steps
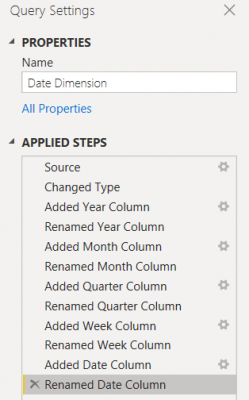
If we have a look at the below transformation’s steps in the ‘Applied Steps’ panel, we should instantly notice the improvement that can be made. We have the default names applied which are not offering much understanding.
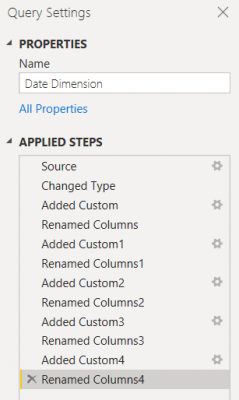
Instead, we should rename each step to offer instant clarity to the individual who may need to continue working with the Power BI solution, or for our own benefit when returning back to the Power BI solution after a long period.
After renaming each step, we should now have a list of transformation steps that offer instant clarity, as the below image illustrates:
Reduce the Transformation Steps
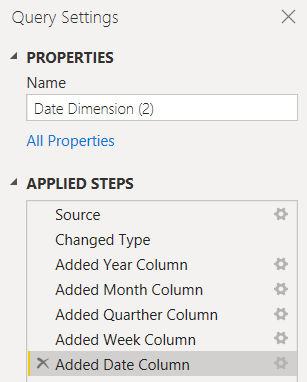
Apart from renaming all the steps, we should also aim to reduce the number of transformation steps. So, let’s continue with the example from above. We have a pair of transformation steps for each column we are deriving. One transformation step for deriving the actual column and another step for renaming the column. In this case, we can combine these two transformation steps together.
For example, when we select ‘Custom Colum’, to derive a column, we should also take advantage of naming the column at the same time, rather than generating a second transformation step:
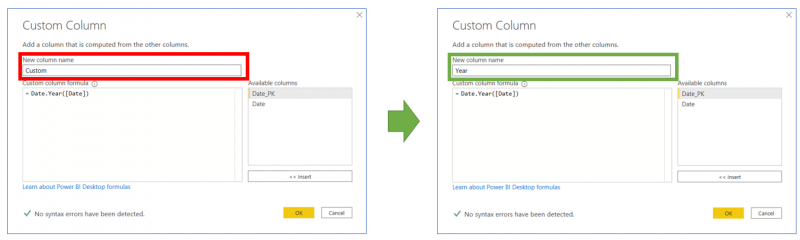
Doing this removes the need for the second step used to rename the custom column, therefore reduces the transformations step from 10 to 5:
Summary
So that’s all for the first 5 best practice tips. I hope you enjoyed these tips that are sure to help in creating Power BI solutions that reduce the risk of error, are more manageable, and much more user friendly. Stay tuned for Part 4 where we will be exploring 5 more Power BI best practice Tips.
Introduction to Data Wrangler in Microsoft Fabric
What is Data Wrangler? A key selling point of Microsoft Fabric is the Data Science
Jul
Autogen Power BI Model in Tabular Editor
In the realm of business intelligence, Power BI has emerged as a powerful tool for
Jul
Microsoft Healthcare Accelerator for Fabric
Microsoft released the Healthcare Data Solutions in Microsoft Fabric in Q1 2024. It was introduced
Jul
Unlock the Power of Colour: Make Your Power BI Reports Pop
Colour is a powerful visual tool that can enhance the appeal and readability of your
Jul
Python vs. PySpark: Navigating Data Analytics in Databricks – Part 2
Part 2: Exploring Advanced Functionalities in Databricks Welcome back to our Databricks journey! In this
May
GPT-4 with Vision vs Custom Vision in Anomaly Detection
Businesses today are generating data at an unprecedented rate. Automated processing of data is essential
May
Exploring DALL·E Capabilities
What is DALL·E? DALL·E is text-to-image generation system developed by OpenAI using deep learning methodologies.
May
Using Copilot Studio to Develop a HR Policy Bot
The next addition to Microsoft’s generative AI and large language model tools is Microsoft Copilot
Apr