
Power BI certainly has come a long way, with its strong roots as a self-service tool, easy to use capabilities and its continuous push and drive in the enterprise space. However, I still find many developing and maintaining Power BI solutions that can benefit greatly by applying some changes which will result in Power BI solutions responding faster, consuming fewer resources, being more aligned to best practice and performing better overall.
With that said, I thought I will kick off the new year with a four-part blog series highlighting the top 10 tips for performance and best-practice. Each blog will be broken down into the following parts:
- Top 10 Power BI Performance Tips (Part 1)
- Top 10 Power BI Performance Tips (Part 2)
- Top 10 Power BI Best-Practice Tips (Part 3)
- Top 10 Power BI Best-Practice Tips (Part 4)
When developing any new solutions in Power BI I always look to incorporate all the tips we will be exploring in these blogs, for both performance and best-practice, so I recommend that you implement these throughout your Power BI development process too.
Tip 1) Fewer Columns, Fewer Rows
In many cases, we load more data than needed into Power BI simply because Power BI can handle large data volumes. However, as the solution starts to scale out this can have a direct hit on performance. Once we go through the process of ingesting data into Power BI by selecting the ‘Get data’ button, the appropriate connector and if applicable, the connectivity type, we should also be asking ourselves the following questions:
- Will these columns/rows assist us in the analysis of the data?
- Will these columns/rows assist us in the decision-making process?
- Will we be using these columns/rows in calculations or to establish a relationship?
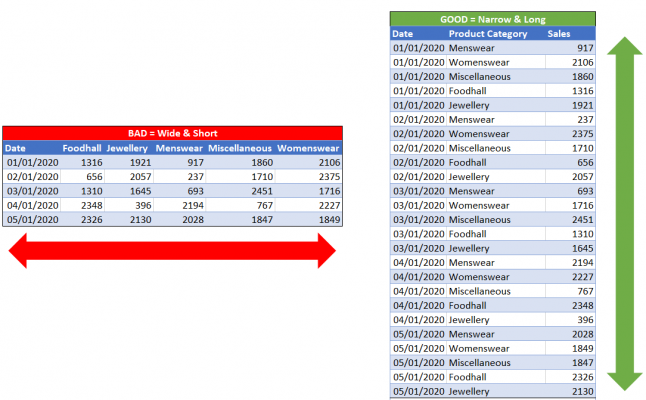
If any of the data in question to be ingested into Power BI, does not satisfy the above, we should simply leave it out of our solution. Why ingest the last 5 years’ worth of data when all that is required is the analyse of this year’s current performance against the previous year? Why should we import all descriptive columns for the product dimension when all we need is the single column of the product name? Again, it easy at the time of ingesting data to load everything and not go through this process, but to ensure our Power BI solution is consuming fewer resources and performing at its highest, we should make our queries hold fewer columns (narrow) and fewer rows (short).
To add some detail to the above, when ingesting data into Power BI the process is to go through Power Query for any data shaping and data transformation operations and then the data gets loaded into Power Pivot, which is a compressed and columnar database that stores data in-memory through the VertiPaq engine. Now, we are not going to go into detail of the VertiPaq engine, but the one thing that is very important to take away from this is that the VertiPaq engine is a columnar storage engine, therefore compresses columns. For this reason, we should be more conscious about the number of columns we are ingesting, over the number of rows. This is highlighted in the below image, we are better of having less columns and more rows, then more columns and less rows.
Tip 2) Push Transformations to Source Side
Power Query is a powerful data transformation and data shaping tool that can easily process transformations directly in Power BI. In fact, it is such a great tool that we may try doing everything in Power Query. However, many times I have come across solutions that are processing tens of millions of rows with various types of transformations, therefore an increase in performance can be achieved by pushing some of the workload back to the source.
Okay, what do we mean by pushing the workload back to the source side? Let’s break this down to make sense of it. When opening Power BI Desktop it is an empty canvas as no data exists in the platform, so the first thing we do is select ‘Get data’. From here, we go on an select the appropriate connector for ingesting data into Power BI. We then have the option to select ‘Transform Data’ which opens up Power Query (equivalent to clicking on ‘Edit Queries’ from the ribbon). When in Power Query, we can apply various transformations for shaping our data, however, it is important to understand that at this stage we are only storing the top 1000 rows in memory, which are displayed as a preview.
Power Query stores the top 1000 rows in memory first, then applies the transformations in the applied steps pane.
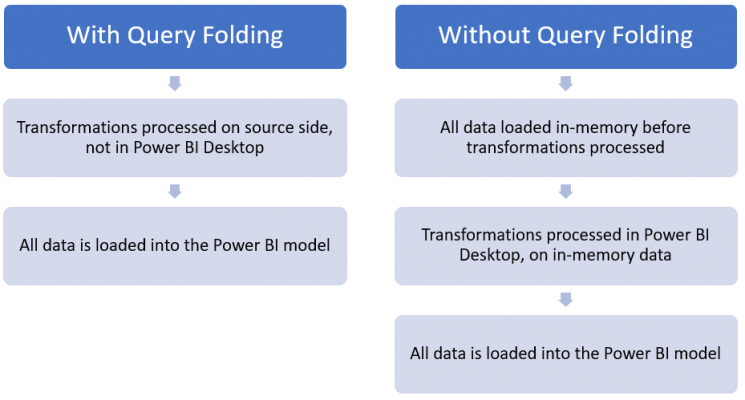
This makes sense, after all, imagine storing all the data into memory whilst using Power Query and waiting for transformations to be applied, this would certainly increase waiting times. In fact, that would be the equivalent of clicking on ‘Close & Apply’ every time a transformation is applied. So, once we finish applying all transformations and our data is in the expected format, by clicking ‘Close & Apply’ Power Query loads the data to Power Pivot which is storing all the data into memory and then applying the transformations in the applied steps pane.
Once clicking on ‘Close & Apply’ Power Query loads all the data to Power Pivot and applies the transformations in the applied steps pane.
Now that we have the above knowledge, lets go back to the question of what do we mean by pushing the workload back to the source side? As Power BI stores data in memory, it is less efficient to load all data into memory and then apply transformations, rather than apply any transformations directly in the source and simply load the result set into Power BI. This reduces the number of resources necessary to process the import of data and increases query performance.
Now, this can mean some work is required on the underlying data source, which in some cases may have some blockers due to a lack of skills with the underlying technology, permission levels or waiting times for the appropriate team to implement the required changes. This brings us to the mechanism of Query Folding, which is the process of converting all the transformations applied directly in Power Query (written in M language) to the native language of the underlying data source, therefore all transformations are not completed on your machine but on the source side.
You can take advantage of Query Folding directly in Power BI Desktop, but there are some factors that you should be aware of, such as:
- The underlying data source must support the concept of accepting query folding requests. This includes relational databases, OData sources such as SharePoint list, Exchange and Active Directory.
- Not all types of transformation support Query Folding, such as if you have ‘Remove Top Rows’ this will not be sent back to source-side.
- Once a transformation step has been applied that does not support Query Folding has been applied, all other steps to follow will require the data to be first loaded to memory.
Tip 3) Disable Load of Queries
In many performance optimisation scenarios I have been involved in, I find many tables loaded into Power BI which are not used for reporting, establishing relationships or creating calculations. Before going on, any Queries loaded into Power Query will be loaded to Power Pivot, therefore consume precious memory. Now, the common reason for these tables existing is that they are acting as staging tables in Power Query, therefore only being ingested for transforming another set of data.
For example, you have ingested dataset ‘A’ which contains all employee details into Power BI, great! However, for the analysis that must be conducted the column ‘NI’ is required, which is stored in another source named dataset ‘B’. For this reason, dataset ‘B’ is also loaded into Power BI, only to apply a merge with dataset ‘A’ and derive the column ‘NI’.
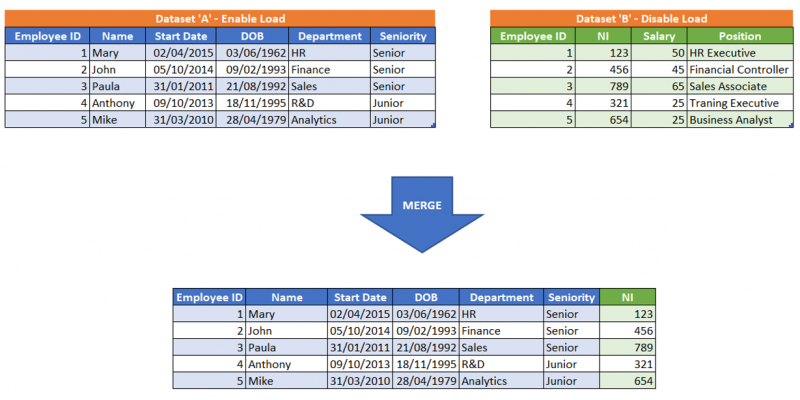
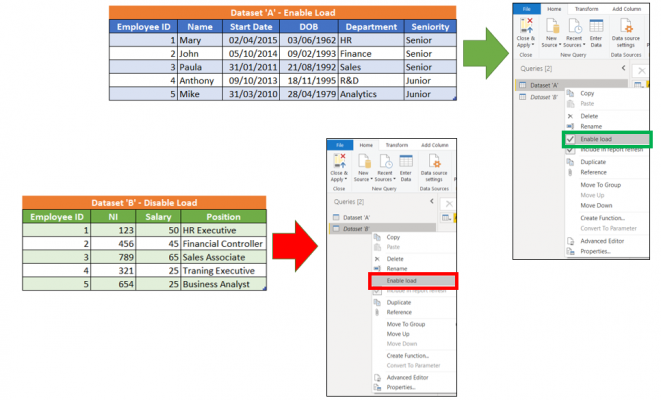
Once this has been done, what I usually find is both dataset ‘A’ and dataset ‘B’ are loaded into Power Pivot. Let’s stop this! We should right-click on dataset ‘B’ and deselect ‘Enable load’ which disables Power Query from loading this Query into Power Pivot, therefore not using up memory unnecessarily.
When we are disabling a Query from being loaded into Power Pivot, this does not mean transformations such as the merge explained above, will be broken at refresh. All the transformation steps applied in Power Query between the two datasets will run as though the Query was never disabled. The only difference, it will not be loaded into the model and not be available for reporting, therefore reducing the memory consumption.
Tip 4) Remove High Cardinality Columns
Before we push forward with this tip, it is important to understand that high cardinality columns are referring to columns ingested into Power BI that have a high percentage of unique values. As mentioned earlier, data is loaded into Power Pivot, which is a compressed and columnar database and the reason we should remove high cardinality columns is the compression works much less efficiently when compressing high cardinality columns.
The more unique values a column contains, the less efficient the compression will be.
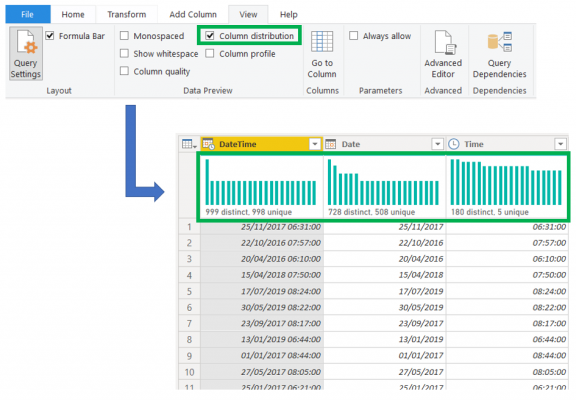
The example I always use to explain high cardinality columns is a column that is commonly ingested into Power BI, which is ‘DateTime’. If we are working with three years’ worth of data, the count of unique dates would be 1095. Now, if the date and time are combined into a single column we must multiply 1095 by all the possible combinations of time. Therefore, if the time attribute we are storing is the hour of the day, therefore a single value in the ‘DateTime’ column is formatted as dd-mm-yyyy hh, the number of unique values will exceed 1095 and instead be multiplied by all the possible values of time which are 24, since we have 24 hours in the day. Therefore, from 1095 unique values, we now have 1095 multiplied by 24 which is 26,280. If we also have minutes and seconds, this number of unique values will shoot up dramatically, causing the compression to work less efficiently.
To identify columns that are of high cardinality, we can use the capabilities such as ‘Column distribution’ which are available in Power Query or even better use the VertiPaq Analyzer which I recommend for identifying high cardinality columns. An important note, if you use the column distribution capability in Power BI, this will only apply to the top 1000 rows unless changed.
Tip 5) Align to a Star Schema
This is by far the most important performance tip in Power BI that I always recommend. In fact, it’s so important that i would go on to say by pushing to model your data as close to a star schema, resolves issues that you are currently unaware of and stops issues which are in the making from arising at a later stage. If you need to do anything when creating a Power BI solution, it will be to align your model as close to a Kimball Star Schema.

A star schema pushes data in Power BI to be modeled in a way that has less tables and less relationships, therefore bringing everything as close together as possible.
This consists of a single Fact table that contains numerical attributes for measuring. Think of numerical columns such as revenue or available stock which are summed and counted in order to assist us in the analysis of data. Furthermore, the star schema contains Dimension tables around the Fact table with descriptive attributes for providing context to the numerical attributes. For instance, we know we have a count of 300 available items in stock through the Stock Fact Table, but through the Product Dimension Table, we know for which particular item.
The core reason for using a star schema is for the faster retrieval of data and for creating BI solutions that are scalable. To break this down more, some of the benefits that come with modeling data as a star schema are:
- Simplicity: Easy to read, use, and understand. Facts contain numerical attributes to measure and count, whilst Dimensions contain descriptive attributes for filtering
- Performance: Less tables and fewer relationships between tables, therefore increases retrieval time of data
- Capabilities: Leverage the full advantages of Power BI drill-down, drillthrough and other various capabilities for analysing data
- Model Size: Reduces the amount of memory being consumed due to limiting the number of tables and relationships
- Scalability: Easy to extend for accommodating new dimensions, columns, and measures
Summary
Power BI through its many easy to use capabilities enables individuals and organisations to find answers to questions very efficiently. With this said, we should also aim to have all our Power BI reports performing at their most optimum level as this means offering the best possible experience to the business and report consumers. From all the tips we explored above, I can easily single out aligning our data model to a star schema as the most important tip which we should always aim to achieve. Stay tunes for Part 2 where we will be exploring 5 more Power BI Performance Tips.
______________________________
Twitter: @Data_Laz
Email: Lazaros.viastikopoulos@adatis.co.uk
Introduction to Data Wrangler in Microsoft Fabric
What is Data Wrangler? A key selling point of Microsoft Fabric is the Data Science
Jul
Autogen Power BI Model in Tabular Editor
In the realm of business intelligence, Power BI has emerged as a powerful tool for
Jul
Microsoft Healthcare Accelerator for Fabric
Microsoft released the Healthcare Data Solutions in Microsoft Fabric in Q1 2024. It was introduced
Jul
Unlock the Power of Colour: Make Your Power BI Reports Pop
Colour is a powerful visual tool that can enhance the appeal and readability of your
Jul
Python vs. PySpark: Navigating Data Analytics in Databricks – Part 2
Part 2: Exploring Advanced Functionalities in Databricks Welcome back to our Databricks journey! In this
May
GPT-4 with Vision vs Custom Vision in Anomaly Detection
Businesses today are generating data at an unprecedented rate. Automated processing of data is essential
May
Exploring DALL·E Capabilities
What is DALL·E? DALL·E is text-to-image generation system developed by OpenAI using deep learning methodologies.
May
Using Copilot Studio to Develop a HR Policy Bot
The next addition to Microsoft’s generative AI and large language model tools is Microsoft Copilot
Apr