The Power BI Analysis Services Connector is used in order to expose a Tabular model to Power BI allowing end users to consume data from the model directly for building of reports and ad-hoc analysis.
The setup of the connector is very straightforward however you will should bear the following in mind
– Only Tabular models are supported with the connectors – you will not be able to use this to enable reporting from a multidimensional database.
– The Analysis Services Connector performs best if it is hosted on the same server that hosts the Tabular model.
– The speed of the internet connection between the server running the Analysis Server Connector and the Power BI service is crucial to performance.
– You can’t run the Analysis Services Connector on a server also running either the Data Management Gateway or the Power BI Personal Gateway.
Installation Steps
1. Download the connector from http://www.microsoft.com/en-us/download/details.aspx?id=45333
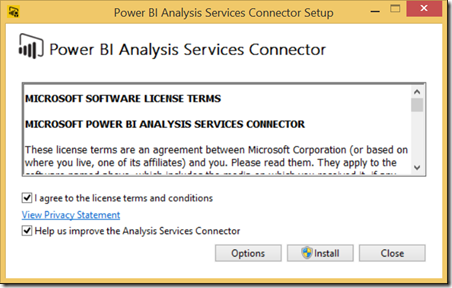
2. Run the Analysis Services Connector Setup Program on the machine hosting the Tabular model.

3. Once the installation has completed you will be given the option to launch the connector

4. Enter the login details required to connect to Power BI

5. If the details are correct you will see the below screen:

6. Enter the account details required to connect to the Tabular Instance – clearly this needs to be an account with access to read from the Tabular model.

7. Give the connection a suitable name and a friendly error message to be displayed to users in the case that the connection fails

This should complete the wizard, the next step is to log onto the Power BI site – if all has gone well you should see the model as per the below.

Introduction to Data Wrangler in Microsoft Fabric
What is Data Wrangler? A key selling point of Microsoft Fabric is the Data Science
Jul
Autogen Power BI Model in Tabular Editor
In the realm of business intelligence, Power BI has emerged as a powerful tool for
Jul
Microsoft Healthcare Accelerator for Fabric
Microsoft released the Healthcare Data Solutions in Microsoft Fabric in Q1 2024. It was introduced
Jul
Unlock the Power of Colour: Make Your Power BI Reports Pop
Colour is a powerful visual tool that can enhance the appeal and readability of your
Jul
Python vs. PySpark: Navigating Data Analytics in Databricks – Part 2
Part 2: Exploring Advanced Functionalities in Databricks Welcome back to our Databricks journey! In this
May
GPT-4 with Vision vs Custom Vision in Anomaly Detection
Businesses today are generating data at an unprecedented rate. Automated processing of data is essential
May
Exploring DALL·E Capabilities
What is DALL·E? DALL·E is text-to-image generation system developed by OpenAI using deep learning methodologies.
May
Using Copilot Studio to Develop a HR Policy Bot
The next addition to Microsoft’s generative AI and large language model tools is Microsoft Copilot
Apr