If like me, you’ve been keeping tabs on what Microsoft has been up to in the Power Platform world, you would have noticed that there are two concepts that are regularly referenced in their architectures and generally associated to each other, Azure Data Lake Storage (ADLS) Gen 2 and Common Data Model (CDM).
As my colleague Francesco Sbrescia, referenced in his blog, Microsoft’s ultimate goal is for the CDM to be the de facto standard data model. However, although there is a fair amount of resources talking about the capabilities and features, it can be a bit confusing to understand how you can actually store your data in the CDM format in ADLS and use it to run data analytics such as data warehousing, Power BI reporting and Machine Learning.
As John Macintyre brilliantly summarised back in late 2018, “Azure Data Services enables advanced analytics that let you maximize the business value of data stored in CDM folders in the data lake. Data engineers and data scientists can use Azure Databricks and Azure Data Factory dataflows to cleanse and reshape data, ensuring it is accurate and complete. Data from different sources and in different formats can be normalized, reformatted, and merged to optimize the data for analytics processing. Data scientists can use Azure Machine Learning to define and train machine learning models on the data, enabling predictions and recommendations that can be incorporated into BI dashboards and reports, and used in production applications. Data engineers can use Azure Data Factory to combine data from CDM folders with data from across the enterprise to create an historically accurate, curated enterprise-wide view of data in Azure SQL Data Warehouse. At any point, data processed by any Azure Data Service can be written back to new CDM folders, to make the insights created in Azure accessible to Power BI and other CDM-enabled apps or tools.”
It’s fair to say there have been some considerable changes in the Azure landscape over recent years. This blog will show how to integrate Dataverse with Microsoft Fabric using shortcuts. You can read more about Microsoft Fabric here and here.
Please bear in mind that at the time of writing, (September 2023) this feature is in Public Preview and is susceptible to changes. This can only be used if you have a Power BI Premium or Azure Fabric Capacity.
Process Overview
The new Power Apps feature called ‘View in Microsoft Fabric’ allows organisations to explore the Dynamics 365 data in Microsoft Fabric without having to export data or build transformation pipelines. By leveraging the power of Fabric shortcuts, the data is updated and changes are reflected in Fabric automatically. The data can then be explored directly in the Fabric environment, using SQL, Python or Spark, or in your favourite IDE by using the SQL endpoint associated to the Fabric Lakehouse.
Let’s dive into the process.
- Navigate to Power BI and create a new connection.
- Connection Type: Cloud
- Connection name: Use the Dynamics environment URL
- Connection type: Dataverse
- Environment domain: Use the Dynamics environment URL
- Authentication method: OAuth 2.0
- Login to Power Apps, ensuring that you append ?athena.shortcuts=true&athena.mdl=true&athena.cds2=true. Eg.
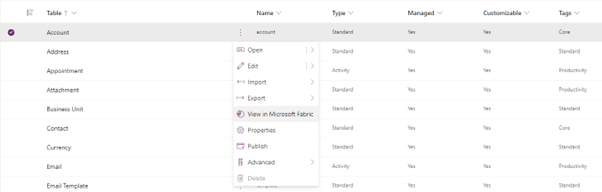
- Choose Tables on the left navigation and select the tables you want to sync. Click on the vertical ellipsis and select View in Microsoft Fabric. See below.
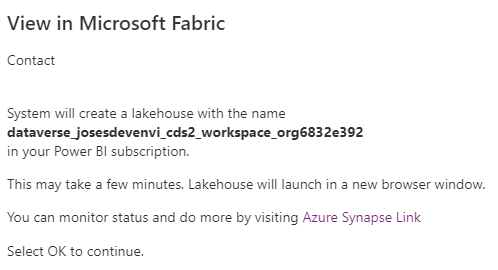
- A message stating a new workspace and Lakehouse will be created in the PBI workspace will appear. Click OK if you are happy to proceed. See below.
On the left menu, open Synapse Link. If not visible, select More and Discover All.
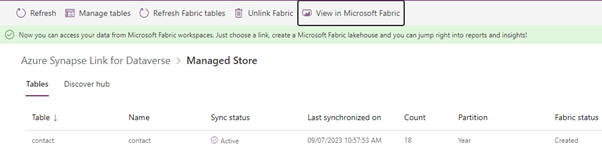
- A new synapse link named Manage Store will be available. Open the link to see the syncing status as well as a button that will take you to the new Fabric Lakehouse.
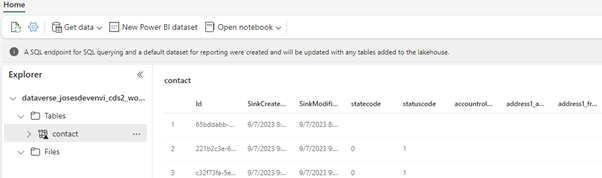
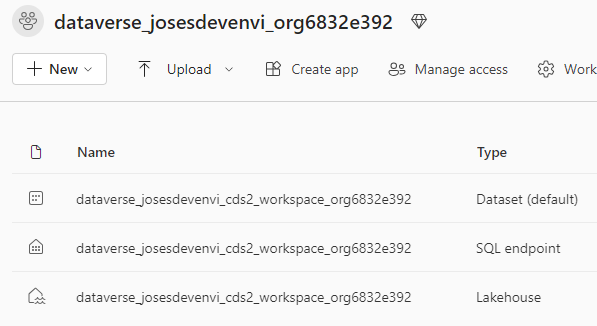
When navigating to the workspace root, we can see 3 new items –
- A Lakehouse – where we can create notebooks and explore the data using Spark.
- A SQL endpoint that can be used to connect your favourite IDE, like SSMS or Data Studio.
- A Dataset, which can be used to build Power BI reports.
See below.
Final thoughts
Although it happens in the background and is not visible to the end user, in a similar fashion to what was described in my previous blog, the data does not land directly in the delta format. Instead, there is a job that converts the data to the delta format. According to Microsoft, during preview, this process may take up to 30min and the initial copy more than 30min. Here is the link for the official Microsoft documentation.
If you enjoyed this blog, you can check out my other blogs in the series:
- Export to data lake (Common Data Service) – Legacy
- Power BI Dataflows
- Azure Data Services – Databricks
- Azure Data Services – Data Factory Data Flows
Introduction to Data Wrangler in Microsoft Fabric
What is Data Wrangler? A key selling point of Microsoft Fabric is the Data Science
Jul
Autogen Power BI Model in Tabular Editor
In the realm of business intelligence, Power BI has emerged as a powerful tool for
Jul
Microsoft Healthcare Accelerator for Fabric
Microsoft released the Healthcare Data Solutions in Microsoft Fabric in Q1 2024. It was introduced
Jul
Unlock the Power of Colour: Make Your Power BI Reports Pop
Colour is a powerful visual tool that can enhance the appeal and readability of your
Jul
Python vs. PySpark: Navigating Data Analytics in Databricks – Part 2
Part 2: Exploring Advanced Functionalities in Databricks Welcome back to our Databricks journey! In this
May
GPT-4 with Vision vs Custom Vision in Anomaly Detection
Businesses today are generating data at an unprecedented rate. Automated processing of data is essential
May
Exploring DALL·E Capabilities
What is DALL·E? DALL·E is text-to-image generation system developed by OpenAI using deep learning methodologies.
May
Using Copilot Studio to Develop a HR Policy Bot
The next addition to Microsoft’s generative AI and large language model tools is Microsoft Copilot
Apr