Fabric is the newest all-in-one analytics solution from Microsoft. It combines multiple components (some existing, some new) into a single integrated environment. One of these new components is Data Activator. As Data Activator is still in development, there is still more functionality to be added. This blog shares some of the current abilities and uses for Data Activator, along with ideas for how you can use it in your own business situations.
One of the biggest challenges with big data is understanding it. With tools like Power BI, we are now able to understand and analyse data better than ever before. But when do we act on it? Do we have to manually look at these reports daily just to check everything is going ok? This is where Data Activator comes in. Data activator is a no-code tool that automatically takes actions when certain conditions are met in the data. These actions can vary from alerts in Microsoft Teams, calling stored procedures, triggering other fabric items like a pipeline, or even retraining AI models.
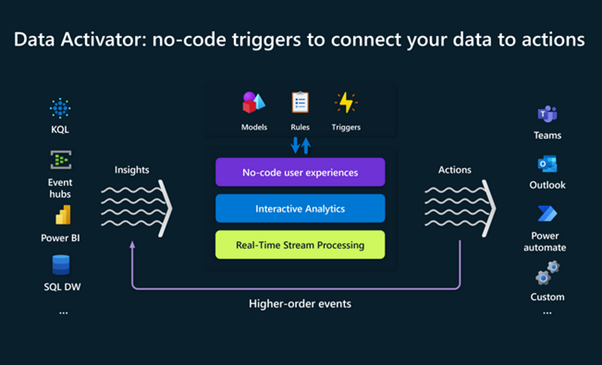
How does it work?
We can ingest data from multiple various locations, define patterns to monitor from the data then trigger an action. An action could be anything from an alert to a flow in Power Automate.
Now, you can already create alerts from Power BI, SSRS or even 3rd party tools so what’s so special about Data Activator?
Data Activator is a no-code tool integrated within fabric, so no set-up is required and it’s easy to use. Currently, Power BI only allows triggers on Cards, KPIs and Gauges, so having the ability to create triggers from other visuals is powerful, along with fact that Data Activator can have data feeds from other sources including Eventstreams.
Some potential use cases could be:
- If stock is low in a shop, automatically send a replenishment.
- When trains are running late, the ability to adjust routes and timings.
- Alert account teams when customers fall into arrears, with customisable time or value limits per customer.
- Alert a store manager to move food from failing freezers, before it spoils.
- Alert on the health of a data pipeline.
- Create a Jira ticket to fix a bug when a bug occurs.
Demo
To use Data Activator, we need to first go to Fabric. You can get a free preview trial if you are an existing Power BI user. In general, a Power BI license with a premium capacity is required. From the home screen, select Data Activator which will take you to the Data Activator home page.
Create a Reflex
A Reflex holds all the information needed to connect to data and then monitor for conditions and act. Ideally, it’s best to have a reflex item for each business process or area. You can create a reflex from the Data Activator home page with the “Reflex” button or click “Create” in the side menu and select Reflex.
Get Data
Once a Reflex has been created, open it up and click on the ‘get data’ button. You should see something like this:
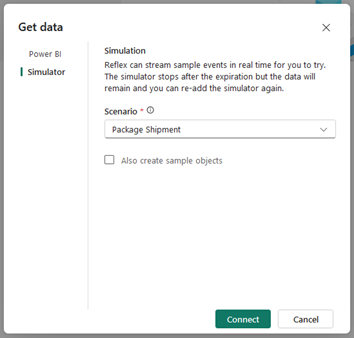
Currently the only options are a Simulated event stream or Power BI (This blog will show you how to generate data from Power BI later on).
Eventually, more sources should be added including Event hubs, SQL DW and more.
With the Simulated Scenario “Package Shipment” selected, click on connect. Once loaded, you shall now see a table which simulates data coming in from an event stream. From this, you can now assign the data to a new or existing object. An object is something you’d like to monitor. For example, shops, vehicles, customers, etc…
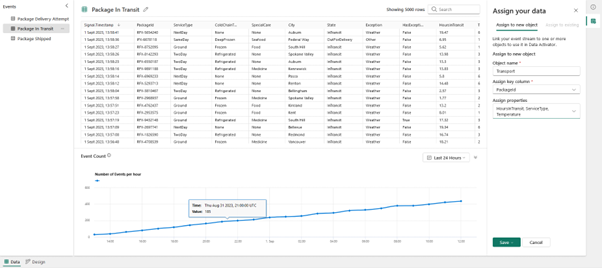
One or more event streams can be combined to make an object. As you can see on the right of the above image, I’m creating an object based on Transport. Once an Object exists, triggers can be created based on the properties or event streams. Properties can be created or altered within an object.
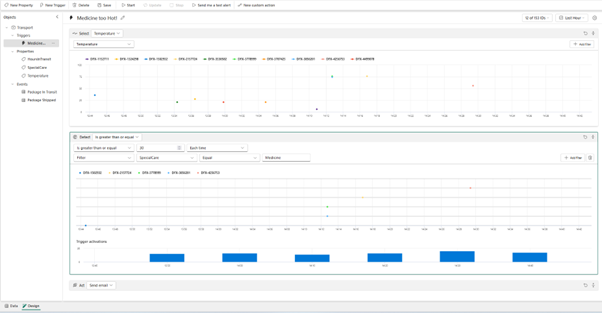
You can choose what to monitor, and then what it detects. With the detection there are some genuinely nice touches. Standard things like comparing two values are included, but we’re given a greater level of control here. We can check if it’s the first time a value enters a region, or how long the value stays in that region. The detection can also be dependent on other properties, in this example, I’m checking the temperature for all SpecialCare that is a Medicine.
When designing a trigger, the table shows you an idea of how many times the trigger would have fired, along with the ability to send a test alert.
Then, you must decide what happens once the condition is met. This can simply be an email, Teams message or something more complicated like a flow in Power Automate. Remember to ‘start’ the trigger once you have created it.
Power BI visual
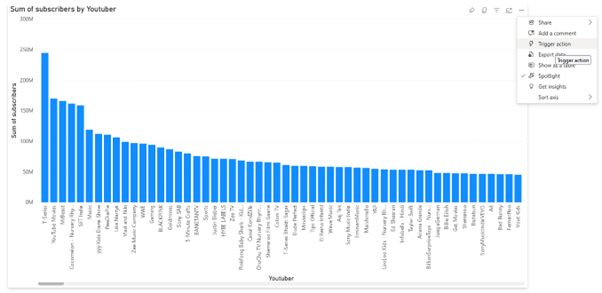
This is remarkably like before, except the way we get data is by going to the report, opening the options, and selecting “Trigger Action”- see below.
A screen should then pop up where you can decide the data refresh rate and what you’d like to measure.
Limitations
As I’ve been playing around, there are a few limitations which I’ve come across:
- Still quite clunky and slow,
- Limitations with filtering,
- Once you’ve loaded in report data, you can’t edit what’s being imported,
- Can’t remove event data from an object once added.
As Data Activator is still in development, we can expect to see many changes and updates over the coming weeks and months. If you would like to learn a little more about Data Activator or keep up to date with it, here are a couple of useful links:
Microsoft Blog: https://blog.fabric.microsoft.com/en-us/blog/driving-actions-from-your-data-with-data-activator/
YouTube Demo: https://www.youtube.com/watch?v=b_utCEGk7xw
GitHub documentation and walkthrough: https://github.com/microsoft/dataActivator/blob/main/ConsolidatedDocs.md
Introduction to Data Wrangler in Microsoft Fabric
What is Data Wrangler? A key selling point of Microsoft Fabric is the Data Science
Jul
Autogen Power BI Model in Tabular Editor
In the realm of business intelligence, Power BI has emerged as a powerful tool for
Jul
Microsoft Healthcare Accelerator for Fabric
Microsoft released the Healthcare Data Solutions in Microsoft Fabric in Q1 2024. It was introduced
Jul
Unlock the Power of Colour: Make Your Power BI Reports Pop
Colour is a powerful visual tool that can enhance the appeal and readability of your
Jul
Python vs. PySpark: Navigating Data Analytics in Databricks – Part 2
Part 2: Exploring Advanced Functionalities in Databricks Welcome back to our Databricks journey! In this
May
GPT-4 with Vision vs Custom Vision in Anomaly Detection
Businesses today are generating data at an unprecedented rate. Automated processing of data is essential
May
Exploring DALL·E Capabilities
What is DALL·E? DALL·E is text-to-image generation system developed by OpenAI using deep learning methodologies.
May
Using Copilot Studio to Develop a HR Policy Bot
The next addition to Microsoft’s generative AI and large language model tools is Microsoft Copilot
Apr