As I mentioned previously, SSRS 2008 allows us to use some nice visualisation techniques in our reports. WinLoss graphs are used to show (wait for it……) the trend of wins and losses over time. The usual example is the performance of a sports team during a season, but they are also useful for showing trends over time such as the performance of a KPI. Here’s another quick how-to on building this type of chart in SSRS 2008.
So first we need a dataset with three fields: Series, Time and Value. The first two are fairly self-explanatory, for the third you need to transform your value so it appears as either a 1, -1 or 0 (win, lose, no result/tie). The AdventureWorks built-in cube KPI’s work well here so I’m going to shortcut slightly and use these. If you’re going to use a relational source you may need to do something a little cleverer. For example:
SELECT
    [Month]
    ,[Country]
    ,CASE
        WHEN [SalesAmount] > 10000
        THEN 1
        WHEN [SalesAmount] < 10000
        THEN -1
        WHEN [SalesAmount] IS NULL
        THEN 0
    END AS Winlose
FROM
    [AdventureWorksDW].[dbo].[FactInternetSales]
We’ll be using AdventureWorks (SSAS) “Internet Revenue” KPI. Don’t forget that when using an AS data source in SSRS you basically have to trick it into thinking it’s relational and make sure you have your measures on Columns (as Chris Webb discusses here). Here’s our very simple MDX statement:
SELECT
    KPITrend("Internet Revenue")
ON COLUMNS,
    [Date].[Calendar].[Month].members
    *
    [Customer].[Customer Geography].[Country].members
ON ROWS FROM
    [Adventure Works]
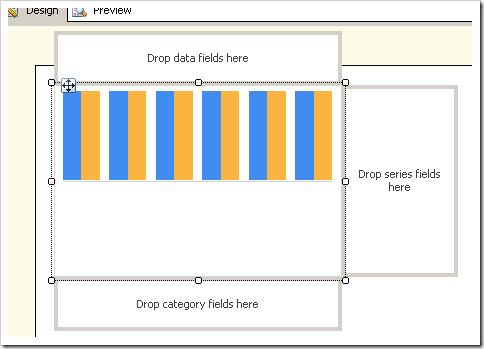
Now lets add a chart – pick the standard column chart and format as follows:
- Right click and delete the chart title and legend;
- Right click on both the axis titles uncheck Show Axis Title;
- Right click on the Y (vertical) axis and select Axis Properties. Under Axis Options set Minimum to -1, Maximum to 1 and Cross At property to 0 (this makes sure our baseline runs between the “wins” and “losses”). Click OK;
- Right click again on the Y axis and uncheck Show Axis;
- Right click on the X axis and select Axis Properties. Under Labels check Hide Axis Labels and do the same for Major and Minor Tick Marks. Under Line set the width to 0.5 and the colour to light grey or similar. Click OK.
You should now have something like this:

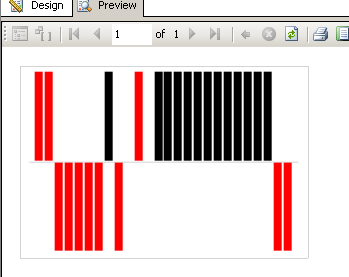
Now lets add some data:
-
- Drag your Time field from the Report Data pane into the category area;
- Drag your Value field into the Data Field area;
- Right click on your series and select Series Properties. Under Fill set the colour suitably. In our example we’re going to show wins as black and losses as red using a switch statement in an expression:
=Switch
(
    Fields!Internet_Revenue_Trend.Value = 1, "Black",
    Fields!Internet_Revenue_Trend.Value = -1, "Red"
)
If you preview the chart now it should look something like this:
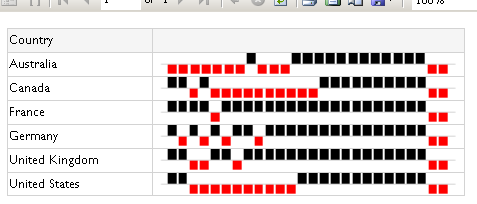
To finish off we need to add the chart inline to a table:
- Add a table and delete the third column;
- Set the DataSetName property to the same as your chart;
- Right click on the second row and add a group (using the adjacent above option). Select your Series value (in our case: Country) from the drop down;
- Delete the bottom row;
- Drag your Series field into the First column, second cell;
- Drag your chart into the second column, second cell.
Finally add a bit of formatting to your table and you’re done!
This also works in SSRS 2005 – though doesn’t render quite a cleanly.
Introduction to Data Wrangler in Microsoft Fabric
What is Data Wrangler? A key selling point of Microsoft Fabric is the Data Science
Jul
Autogen Power BI Model in Tabular Editor
In the realm of business intelligence, Power BI has emerged as a powerful tool for
Jul
Microsoft Healthcare Accelerator for Fabric
Microsoft released the Healthcare Data Solutions in Microsoft Fabric in Q1 2024. It was introduced
Jul
Unlock the Power of Colour: Make Your Power BI Reports Pop
Colour is a powerful visual tool that can enhance the appeal and readability of your
Jul
Python vs. PySpark: Navigating Data Analytics in Databricks – Part 2
Part 2: Exploring Advanced Functionalities in Databricks Welcome back to our Databricks journey! In this
May
GPT-4 with Vision vs Custom Vision in Anomaly Detection
Businesses today are generating data at an unprecedented rate. Automated processing of data is essential
May
Exploring DALL·E Capabilities
What is DALL·E? DALL·E is text-to-image generation system developed by OpenAI using deep learning methodologies.
May
Using Copilot Studio to Develop a HR Policy Bot
The next addition to Microsoft’s generative AI and large language model tools is Microsoft Copilot
Apr