So as the dust settles and everyone calms down, it’s time to move on and get back to what we’re good at! Just in case anyone was worried, we’ll continue to be at the cutting edge of PerformancePoint Services and the MS BI stack as well as looking at SharePoint in more detail.
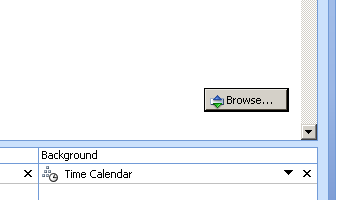
I thought I’d post this one as it’s come up with a couple of our customers recently and isn’t entirely clear at first glance. When you design an Analytic Chart or Grid in Dashboard Designer by default empty rows/columns (or series on a chart) are shown. If you want them to be hidden when the user first opens the chart/grid then click the browse button at the bottom right of the design pane:
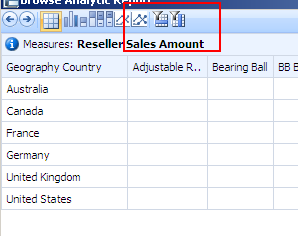
The preview window will appear. Now click either of the two end icons on the toolbar (marked by the red rectangle below) to hide the empty rows/columns (or both)
When you click OK the setting will be saved into your design – you can verify this by going into the MDX view of the query and checking that “Non Empty” now appears in your MDX.
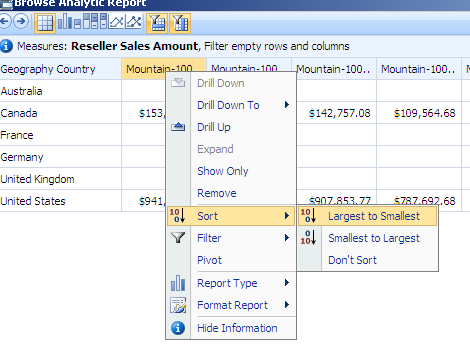
You can use the same method to apply sorting by right-clicking on a column in the browse window and selecting the relevant sort function.
Of course if you are using an MDX query then use the NonEmpty/Non Empty functions directly.
As I’ve pointed out before, don’t forget the built-in Dashboard Designer help which is pretty comprehensive
Introduction to Data Wrangler in Microsoft Fabric
What is Data Wrangler? A key selling point of Microsoft Fabric is the Data Science
Jul
Autogen Power BI Model in Tabular Editor
In the realm of business intelligence, Power BI has emerged as a powerful tool for
Jul
Microsoft Healthcare Accelerator for Fabric
Microsoft released the Healthcare Data Solutions in Microsoft Fabric in Q1 2024. It was introduced
Jul
Unlock the Power of Colour: Make Your Power BI Reports Pop
Colour is a powerful visual tool that can enhance the appeal and readability of your
Jul
Python vs. PySpark: Navigating Data Analytics in Databricks – Part 2
Part 2: Exploring Advanced Functionalities in Databricks Welcome back to our Databricks journey! In this
May
GPT-4 with Vision vs Custom Vision in Anomaly Detection
Businesses today are generating data at an unprecedented rate. Automated processing of data is essential
May
Exploring DALL·E Capabilities
What is DALL·E? DALL·E is text-to-image generation system developed by OpenAI using deep learning methodologies.
May
Using Copilot Studio to Develop a HR Policy Bot
The next addition to Microsoft’s generative AI and large language model tools is Microsoft Copilot
Apr