One of our customers had read Nick Barclay’s post on dynamic sets in SSAS 2008 and was hoping that this would mean that you could create KPI’s with dynamic dimension members. Well the answer is yes and no. It’s already possible to do this in Monitoring (or should I say PerformancePoint Services) using custom sets in the scorecard designer (more on this below). However in PPSM these sets are resolved at the point the Scorecard is rendered in the browser.
This is fine as long as the members of your sets are not affected by the filters applied to your scorecard (member.children for example) – unfortunately the set does not get re-queried when you change a filter. For instance if you were to create a set of your top 10 customers and drag that onto the rows of your scorecard, changing a time filter will not cause the KPI dimension members to change even if you’ve used time.currentmember in your set definition. So you may end up displaying the Top 10 customers for the current month which may be different to the Top 10 for the selected time period.
Update: Please see Nick Barclay’s comment below for a very neat solution to this issue using filter link formulas. (Wish I’d thought of that!)
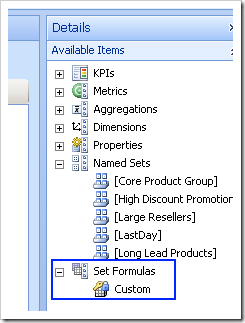
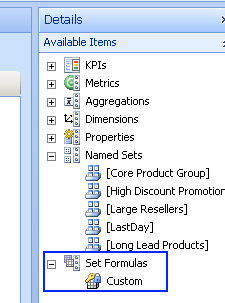
Custom sets in the scorecard designer aren’t the most obvious thing to use nor are they very user-friendly. Your best bet is to use a tool like SQL Management Studio/Mosha MDX Studio to design a query that you know works then paste out the MDX for the set into the custom set formula editor. You access this by dragging the Custom item in the Details pane onto the relevant position on your scorecard:
Paste your set query in to the pop-up dialog. For Example:
TOPCOUNT(
    [Product].[Product Model Categories].[Subcategory].members,
    10,
    [Measures].[Internet Sales Amount]
    )
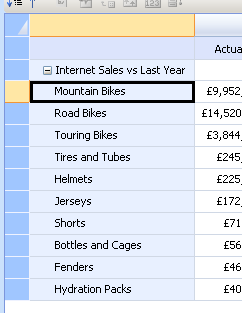
You can then use the update button on the edit tab of the ribbon to see the results. Unfortunately there’s no way to edit the custom set once you’ve added it. You have to delete the dimension members and then add a new custom set.
Introduction to Data Wrangler in Microsoft Fabric
What is Data Wrangler? A key selling point of Microsoft Fabric is the Data Science
Jul
Autogen Power BI Model in Tabular Editor
In the realm of business intelligence, Power BI has emerged as a powerful tool for
Jul
Microsoft Healthcare Accelerator for Fabric
Microsoft released the Healthcare Data Solutions in Microsoft Fabric in Q1 2024. It was introduced
Jul
Unlock the Power of Colour: Make Your Power BI Reports Pop
Colour is a powerful visual tool that can enhance the appeal and readability of your
Jul
Python vs. PySpark: Navigating Data Analytics in Databricks – Part 2
Part 2: Exploring Advanced Functionalities in Databricks Welcome back to our Databricks journey! In this
May
GPT-4 with Vision vs Custom Vision in Anomaly Detection
Businesses today are generating data at an unprecedented rate. Automated processing of data is essential
May
Exploring DALL·E Capabilities
What is DALL·E? DALL·E is text-to-image generation system developed by OpenAI using deep learning methodologies.
May
Using Copilot Studio to Develop a HR Policy Bot
The next addition to Microsoft’s generative AI and large language model tools is Microsoft Copilot
Apr