
This article aims to introduce data skew metrics that are specific to hash-distributed tables in Azure Synapse Analytics and will visualise them in a Power BI dashboard. In the end, it will discuss the importance of the selection of an appropriate distribution column for the performance of operations using the data in the table.
A fundamental feature of the Dedicated SQL Pool in Azure Storage (formerly SQL DW) is the way it can store and operate on tables across multiple distributions and to use them in parallel to provide great performance on large data sets and across various analytical scenarios.
A hash-distributed table distributes rows based on the value in a distribution column. There are three methods for distributing data:
- Round-robin (default)
- Hash
- Replicated
The selection of the distribution column is important for the hash-distributed tables because it affects the way data gets stored and retrieved. It is important to select a column which leads to an even spread of data across each distribution and thus to minimum data skew. This allows for better parallelisation and consequently to better performance.
Skewness measures
Skewness is a measure of the symmetry of distribution. The distribution is skewed if there are significant differences in the values across the distributions, which make them asymmetrical.
We are going to introduce two measures of skewness. The first is Data Skew Percentage, and it is calculated using the formula below:
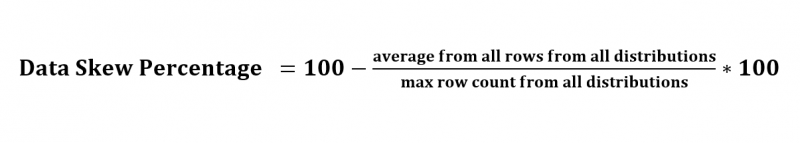
As you can see, the formula is based on the average row count from all distributions divided by the maximum row count among the distributions.
For example, if we have 60 distributions and 59 of them have only 1 row each and the last one has 20 rows then the formula will return:
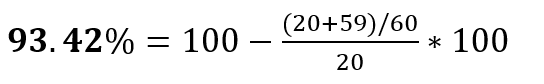
As you can see, the data skew percentage for this data set is very high.
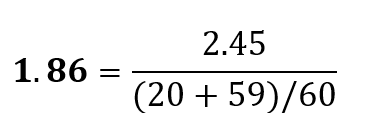
The other formula that we are going to use is for the calculation of the Data Skew Coefficient.

To calculate the Data Skew Coefficient, we need to calculate the standard deviation for the dataset and after that, to divide it by the average row count in all distributions. The skew coefficient does not depend only on the comparison of the distribution with the largest number of rows in it and the average, but considers all distributions in its calculation. Since the value of the standard deviation varies depending on the magnitude of the values it is calculated on, we are normalising it by dividing by the mean (this is a standard metric called Coefficient of variation). This gives us a number which usually varies between 0 for perfectly distributed data and a larger number when the data set has more variability.
Using the example that we used for calculating the Data Skew Percent we can also calculate the Data Skew Coefficient for the same data set:
SQL implementation
Using system tables and dynamic views, we are going to implement these formulas in SQL.
The following script will return information about all available tables on the server. For each table it will return the current distribution table method, distribution column, data skew coefficient, data skew percentage, and some more useful information, such as size on disk and schema name.
SELECT
    [Fully Entity Name]                 = t.full_entity_name,
    [Schema Name]                       = t.schema_name,
    [Entity Name]                       = t.entity_name,
    [Current Distribution Method]       = t.distribution_method,
    [Current Distribution Column]       = ISNULL(t.distribution_column, '-'),
    [Current Rows]                      = SUM(t.rows_count),
    [Distribution Count]                = COUNT(t.rows_count),
    [Current Data Size on Disk MB]      = SUM(t.data_size_MB),
    [Current Index Size on Disk MB]     = SUM(t.index_size_MB),
    [Skew Coefficient]                  = CASE
                                            WHEN SUM(t.rows_count) / COUNT(rows_count) <> 0
                                            THEN ROUND((t.standard_deviation / (SUM(t.rows_count) / COUNT(t.rows_count))) * 1.0, 2)
                                            ELSE 0
                                          END,
    [Skew Percentage]                   = CASE
                                            WHEN MAX(t.rows_count) <> 0
                                            THEN CAST((100.0 - (AVG(CAST(t.rows_count as float)) / MAX(t.rows_count) * 100)) AS DECIMAL(4, 2))
                                            ELSE 0
                                          END
FROM
(
    SELECT
        full_entity_name        = QUOTENAME(s.name) + '.' + QUOTENAME(t.name),
        schema_name             = s.name,
        entity_name             = t.name,
        distribution_method     = tp.distribution_policy_desc,
        distribution_column     = c.name,
        rows_count              = nps.row_count,
        data_size_MB            = (
                                    (
                                        nps.in_row_data_page_count +
                                        nps.row_overflow_used_page_count +
                                        nps.lob_used_page_count
                                    ) * 8.0
                                  ) / 1000,
        index_size_MB           = (
                                    (
                                        nps.reserved_page_count - (nps.reserved_page_count - nps.used_page_count) -
                                        (nps.in_row_data_page_count + nps.row_overflow_used_page_count + nps.lob_used_page_count)
                                    ) * 8.0
                                  ) / 1000,
        standard_deviation      = STDEV(nps.row_count) OVER (PARTITION BY t.object_id)
    FROM
        sys.schemas AS s
        INNER JOIN sys.tables AS t
            ON s.schema_id = t.schema_id
        INNER JOIN sys.indexes AS i
            ON t.object_id = i.object_id
            AND i.index_id <= 1
        INNER JOIN sys.pdw_table_distribution_properties AS tp
            ON t.object_id = tp.object_id
        INNER JOIN sys.pdw_table_mappings AS tm
            ON t.object_id = tm.object_id
        INNER JOIN sys.pdw_nodes_tables AS nt
            ON tm.physical_name = nt.name
        INNER JOIN sys.dm_pdw_nodes AS pn
            ON nt.pdw_node_id = pn.pdw_node_id
        INNER JOIN sys.pdw_distributions AS di
            ON nt.distribution_id = di.distribution_id
        INNER JOIN
        (
            SELECT
                object_id                       = object_id,
                pdw_node_id                     = pdw_node_id,
                distribution_id                 = distribution_id,
                row_count                       = SUM(row_count),
                in_row_data_page_count          = SUM(in_row_data_page_count),
                row_overflow_used_page_count    = SUM(row_overflow_used_page_count),
                lob_used_page_count             = SUM(lob_used_page_count),
                reserved_page_count             = SUM(reserved_page_count),
                used_page_count                 = SUM(used_page_count)
            FROM
                sys.dm_pdw_nodes_db_partition_stats
            GROUP BY
                object_id,
                pdw_node_id,
                distribution_id
        ) AS nps
            ON nt.object_id = nps.object_id
            AND nt.pdw_node_id = nps.pdw_node_id
            AND nt.distribution_id = nps.distribution_id
        LEFT JOIN
        (
            SELECT
                object_id,
                column_id
            FROM
                sys.pdw_column_distribution_properties
            WHERE
                distribution_ordinal = 1
        ) AS cdp
            ON t.object_id = cdp.object_id
        LEFT JOIN sys.columns AS c
            ON cdp.object_id = c.object_id
            AND cdp.column_id = c.column_id
    WHERE
        pn.type = 'COMPUTE'
) AS t
GROUP BY
    t.full_entity_name,
    t.schema_name,
    t.entity_name,
    t.distribution_method,
    t.distribution_column,
    t.standard_deviation;
Additionally, we have one more query that will return information for all distributions for each table. The result set includes the name of the distribution (1, 2, 3, …), the row count in each distribution, as well as the name of the table and current distribution method.
SELECT
    [Entity Name]                   = QUOTENAME(s.name) + '.' + QUOTENAME(t.name),
    [Current Distribution Method]   = tp.distribution_policy_desc,
    [Current Distribution Column]   = c.name,
    [Distribution Name]             = di.name,
    [Row Count]                     = nps.row_count
from
    sys.schemas AS s
    INNER JOIN sys.tables AS t
        ON s.schema_id = t.schema_id
    INNER JOIN sys.indexes AS i
        ON t.object_id = i.object_id
        AND i.index_id <= 1
    INNER JOIN sys.pdw_table_distribution_properties AS tp
        ON  t.object_id = tp.object_id
    INNER JOIN sys.pdw_table_mappings AS tm
        ON t.object_id = tm.object_id
    INNER JOIN sys.pdw_nodes_tables AS nt
        ON tm.physical_name = nt.name
    INNER JOIN sys.dm_pdw_nodes AS pn
        ON nt.pdw_node_id = pn.pdw_node_id
    INNER JOIN sys.pdw_distributions AS di
        ON nt.distribution_id = di.distribution_id
    INNER JOIN
    (
        SELECT
            object_id                       = object_id,
            pdw_node_id                     = pdw_node_id,
            distribution_id                 = distribution_id,
            row_count                       = SUM(row_count),
            in_row_data_page_count          = SUM(in_row_data_page_count),
            row_overflow_used_page_count    = SUM(row_overflow_used_page_count),
            lob_used_page_count             = SUM(lob_used_page_count),
            reserved_page_count             = SUM(reserved_page_count),
            used_page_count                 = SUM(used_page_count)
        FROM
            sys.dm_pdw_nodes_db_partition_stats
        GROUP BY
            object_id,
            pdw_node_id,
            distribution_id
    ) AS nps
        ON nt.object_id = nps.object_id
        AND nt.pdw_node_id = nps.pdw_node_id
        AND nt.distribution_id = nps.distribution_id
    LEFT JOIN
    (
        SELECT
            object_id,
            column_id
        FROM
            sys.pdw_column_distribution_properties
        WHERE
            distribution_ordinal = 1
    ) AS cdp
        ON t.object_id = cdp.object_id
    LEFT JOIN sys.columns as c with(nolock)
        ON cdp.object_id = c.object_id
        AND cdp.column_id = c.column_id
WHERE
    pn.type = 'COMPUTE';
Power BI dashboard
Finally, we are ready to introduce the last part of the article: the creation of the Power BI dashboard. We are going to skip the part regarding the initial project setup, making the connection to the server and importing the data using the queries above, and we will proceed directly to the setup of the dashboard.
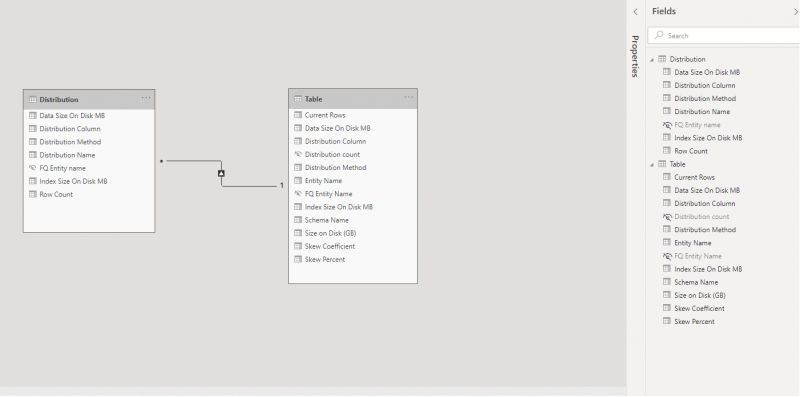
After our data is loaded in our Power BI project, we need to make a relation between our datasets. In our case we will use the [Entity Name] column and the relationship will be many-to-one.
Next, we are going to look at our dashboard.
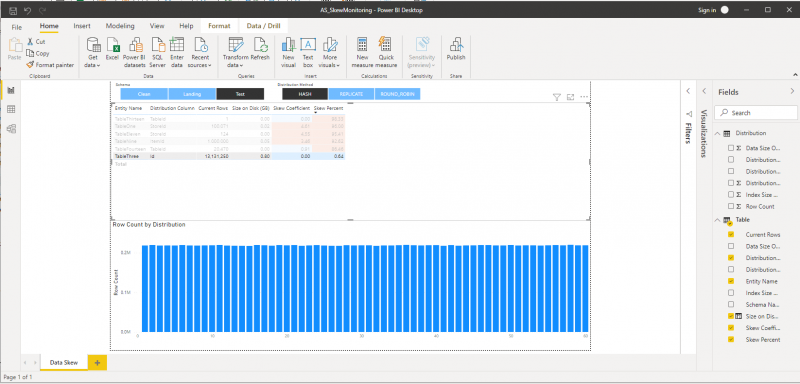
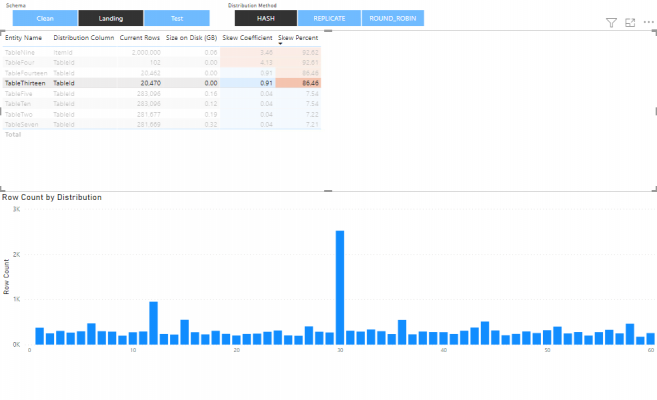
I am going to briefly present the dashboard components and how they can be used. Going from top to bottom, the first thing you see is a table that contains the data returned by the first query. We also have filters above the table which include two options: schema and distribution method. The other feature that are worth noting are the ordering of the results in descending order and the different colour of the Data Skew Coefficient and Percentage columns.
The second thing you can see is a stacked column chart, which is positioned at the bottom. It is related to the results in the table above it. When one row from the table is selected, all available distribution information for that table will be presented on the chart. On the x-axis are the distributions (1…60) and on the y-axis is the count of rows in the concrete distribution.
Analysis of the results
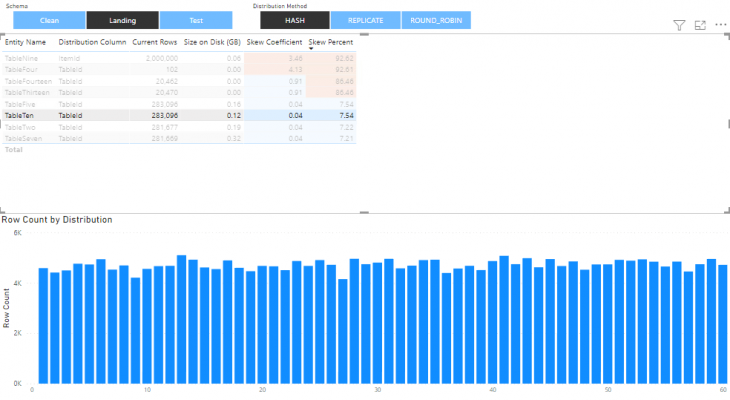
We are ready to review and discuss our results. Ideally, in a perfect case, all the rows are distributed equally across the distributions. As a result, there is no skewness, and the skew percentage and skew coefficient are close to 0. Dashboard 1 (above) and Dashboard 2 show examples of tables with even distributions.
It is recommended that tables with a skew coefficient greater than 3 to be reviewed due to possible problems with the selection of the distribution column. In all such cases, the corresponding skew percentage will also be high. An example of this can be shown below (Dashboard 3 and Dashboard 4). The rows are distributed across the distributions unevenly.
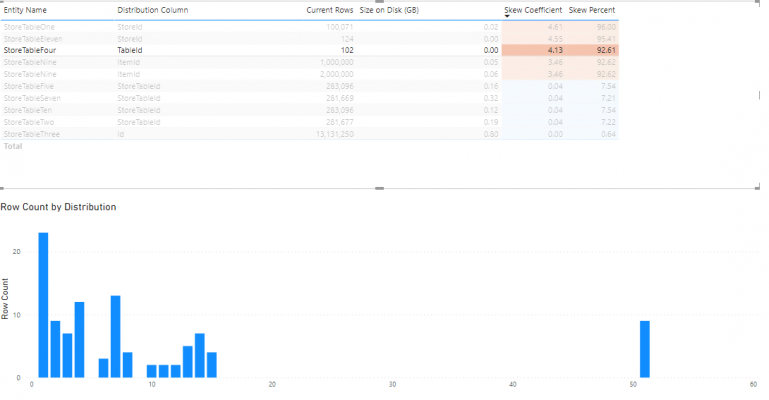
Here the Skew Coefficient is 4.13 and the Skew Percent is 92.61. Both are quite high, and the reason for this can be observed on the chart.
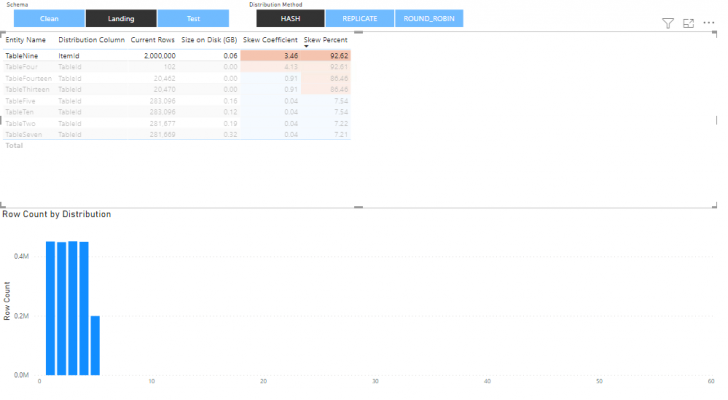
Similarly, for this table we also have very high skew metrics since only five of all the distributions have data in them.
Although it is not a common occurrence to have a low skew coefficient and high skew percentage as a combination, it can still be seen occasionally. This is a result from a relatively even row distribution where only one of the distributions has significantly more data in it compared to the others. In this case the skew coefficient can still have an acceptable value, however the skew percentage will be higher.
Conclusion
For best performance, all the distributions should have approximately the same number of rows. When one or more distributions have a disproportionate number of rows, some distributions will complete their portion of a parallel query before others. The problem with data skewness should not be underestimated. When there is skewness, it should be reviewed and if possible, you should consider choosing a new distribution column based on data and query pattern analysis.
In summary, I believe having a dashboard like this can make our lives easier. It needs to be checked regularly, however this might not happen due to various reasons. As a solution to this I would suggest a stored procedure using the same queries in addition to the dashboard. The main functions of the procedure would be to check the skew percentage and skew coefficient and to send notifications when they are higher than acceptable.
Microsoft provides excellent guidance about choosing a distribution method and columns in the articles below.
Guidance for designing distributed tables using dedicated SQL pool in Azure Synapse Analytics
Choosing hash distributed table vs. round-robin distributed table in Azure SQL DW Service
Introduction to Data Wrangler in Microsoft Fabric
What is Data Wrangler? A key selling point of Microsoft Fabric is the Data Science
Jul
Autogen Power BI Model in Tabular Editor
In the realm of business intelligence, Power BI has emerged as a powerful tool for
Jul
Microsoft Healthcare Accelerator for Fabric
Microsoft released the Healthcare Data Solutions in Microsoft Fabric in Q1 2024. It was introduced
Jul
Unlock the Power of Colour: Make Your Power BI Reports Pop
Colour is a powerful visual tool that can enhance the appeal and readability of your
Jul
Python vs. PySpark: Navigating Data Analytics in Databricks – Part 2
Part 2: Exploring Advanced Functionalities in Databricks Welcome back to our Databricks journey! In this
May
GPT-4 with Vision vs Custom Vision in Anomaly Detection
Businesses today are generating data at an unprecedented rate. Automated processing of data is essential
May
Exploring DALL·E Capabilities
What is DALL·E? DALL·E is text-to-image generation system developed by OpenAI using deep learning methodologies.
May
Using Copilot Studio to Develop a HR Policy Bot
The next addition to Microsoft’s generative AI and large language model tools is Microsoft Copilot
Apr