Microsoft recently released Themes to a Preview version of Power BI. The concept is pretty simple – imagine having standardized colours that can be applied to charts and matrix visuals? This is where Themes come in. The theory is this will ensure Power BI developers adhere to company policies and can do so quickly and efficiently. The reality is Themes are still lacking a lot of key configurables, but I will get onto that later.
Whilst this blog is not going to show you how to import or apply a Theme, it will demonstrate how to create one and what each configuration means. For a great high level walkthrough of the feature, click here. The aim is to not only show how this makes a developers life easier, but where it can actually be improved too.
JSON Configuration File
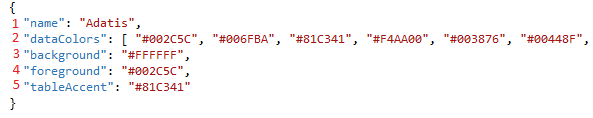
I have pasted the following code into Notepad++, which incorporates the Adatis branding and colour scheme. For many developers, you will recognize the coding language – JSON (JavaScript Object Notation). If you would like to know more about JSON, check out Jason Lengstorf’s blog.
Use the below code as a template for your Theme:
{
“name”: “Adatis”,
“dataColors”: [ “#002C5C”, “#006FBA”, “#81C341”, “#F4AA00”, “#003876”, “#00448F”, “#0051A9”, “#007ED4”,“#008DED”,“#74B238”,“#8EC954”,“#DB9800”,“#FFB60F” ],
“background”: “#FFFFFF”,
“foreground”: “#002C5C”,
“tableAccent”: “#81C341”
}
Notice there are a number of ‘#’ within the code. These are Hex numbers, in which Power BI natively uses to determine a shade of colour. This is common across many reporting/image editing tools.
Configurations Explained
I will now explain what each line of code means and how it will effect a simple un-themed report.

1. The name of the Theme.
2. The colours that appear in a pre-set chart colour palette and the order of which a visual applies them e.g. Dark Blue first, Light Blue second, Green third, etc.
3. Font colour for the matrix or table visual.
4. Primary background colour for a matrix or table visual. Even though the setting says’ ‘foreground’, it is more of a background colour!
5. The table accent applies to a matrix or table visual, displaying as the grid outline or contrasting background colour, depending on what type matrix/table is applied.
Applying a Theme
I have created a quick Power BI report, which is using the default colour schemes applied. The only formatting applied was to the Matrix visual and this was simply changing the style of the grid. Here is how the report currently looks:

Now let’s import and apply the ‘Adatis’ theme. You will see some of the visuals have changed, whereas other elements of the report haven’t. I will explain in greater detail.

1. The Report Title, Slicers and Titles are not affected by the Adatis theme. This is because you cannot currently configure fonts in the JSON file.
2. The matrix visual has updated, using the three configurations form the JSON file:
a. background (White)
b. foreground (Navy Blue)
c. tableAccent (Green)
3. The Pie and Bar chart have picked up the colours in the order they are specified in the JSON file, using the dataColors property. However, note the colour of both data points on the Bar Chart – rather than use different colours, it uses the same primary blue colour. Not ideal if you want to plot one colour for ‘Male’ and another for ‘Female’.
4. The Waterfall chart hasn’t changed at all. We would expect the Adatis colours to have been applied, but this visual seems to ignore the configuration.
We can change the Waterfall Chart manually, using the imported Adatis Colour Palette.

Here is how the chart now looks:

What’s Next?
Whilst the concept of Themes is great, the current preview functionality is extremely limited and very much ‘Version 1’. I am a little disappointed with how inconsistent the application of a theme is, which were highlighted in my points above.
With the majority of new Power BI features, Microsoft continue to improve the usability and functionality over time, so I am very hopeful more Theme properties will be opened up in the underlying JSON configuration file. Options such as font colours/styles, consistent theme application (for all visuals) and company logos are all necessary for this to become really powerful. There were talks of a CSS type of configuration in Power BI, but this has yet to announced or released. Imagine how powerful and cool that would be?
As a BI Consultant, I am not currently comfortable with demoing Themes to a client, simply because of the clear gaps. Once the feature is more mature and in GA, I think enterprise companies will really benefit from standardising reports across their business. For now, Themes will remain a glorified colour palette.
Further Reading
o Jason Lengstorf’s JSON Blog – http://bit.ly/2aU1OHS
o Power BI Report Themes BI Blog – http://bit.ly/2mPq69l
Contact Me
If you would like a copy of the workbook or have any questions about this blog, please leave a comment below.
Twitter: @DataVizWhizz
Introduction to Data Wrangler in Microsoft Fabric
What is Data Wrangler? A key selling point of Microsoft Fabric is the Data Science
Jul
Autogen Power BI Model in Tabular Editor
In the realm of business intelligence, Power BI has emerged as a powerful tool for
Jul
Microsoft Healthcare Accelerator for Fabric
Microsoft released the Healthcare Data Solutions in Microsoft Fabric in Q1 2024. It was introduced
Jul
Unlock the Power of Colour: Make Your Power BI Reports Pop
Colour is a powerful visual tool that can enhance the appeal and readability of your
Jul
Python vs. PySpark: Navigating Data Analytics in Databricks – Part 2
Part 2: Exploring Advanced Functionalities in Databricks Welcome back to our Databricks journey! In this
May
GPT-4 with Vision vs Custom Vision in Anomaly Detection
Businesses today are generating data at an unprecedented rate. Automated processing of data is essential
May
Exploring DALL·E Capabilities
What is DALL·E? DALL·E is text-to-image generation system developed by OpenAI using deep learning methodologies.
May
Using Copilot Studio to Develop a HR Policy Bot
The next addition to Microsoft’s generative AI and large language model tools is Microsoft Copilot
Apr