My job is pretty varied these days :o)
Today I’ve been looking at satisfying some basket analysis type requirements where, for example, we need to determine what other products customers have bought in addition to a known product.
We could have used data mining for this but decided not to as, in this case, it literally was a few mouse clicks away from our existing AS2005 cube.
The implementation was surprisingly straight forward and query results (admittedly on a subset of the full dataset) very impressive.
In an attempt to outline the implementation steps I will add some basket analysis to the Adventure Works sample database to demonstrate how easy it was !
Requirement
List all products (and associated profit margin) that have also been purchased by customers who have bought a road bike from the 550-W range.
Approach
Rather than using data mining to handle queries of this type I want to extend my current cube. In order for the performance to be acceptable we will adopt a variation on the many-to-many distinct count solution discussed in numerous blogs, white papers and articles.
This result of this approach is a new measure group, we’ll call it ‘Customer Cross Purchase’ and a new reference dimension based on product for our ‘known product’, we’ll call this ‘Product Filter’
 From a relational perspective, the product filter dimension provides a lookup for customers (in Customer Cross Purchase) that have purchased that product.
This in turn provides the ability to locate all orders (Internet Sales Fact) for that subset of customers. Once we know all the orders for that subset of customers we can simply list the distinct products that make up those orders. (Product)
Implementation
The measure group contains a distinct set of customers and products that will act as the junction table of our many-to-many. This is a view over the main fact and customer dimension.
CREATE VIEW [dbo].[vCustomerCrossPurchase]
AS
SELECT DISTINCT f.CustomerKey, f.ProductKey
FROM dbo.FactInternetSales AS f INNER JOIN
dbo.DimCustomer AS c ON f.CustomerKey = c.CustomerKey
Next, the fact table [view] is added to the Data Source View, ensuring the relationships to the customer and product dimension are set up.
With the DSV updated, the cube itself can be extended. A new measure group is created together with a Product Filter reference dimension. The dimension usage looks like the diagram below. This ensures the appropriate relationships exist as outlined above
The new measure group is mapped to the product filter and customer dimensions, as per our dsv. Note, this is not done automatically as the real (non referenced) product dimension is selected instead.
To complete the picture, the Customer Cross Purchase measure group is used to create a many-to-many relationship between the Product Filter and the main Internet Sales measure group.
Testing
Once deployed and processed we can test out our modifications to check for some reasonable results.
The following MDX query returns a list of all products that have been bought by customers buying a road bike from their 550-W range in Reading, England.
select
non empty [Product].[Product].members on rows,
[Measures].[Internet Gross Profit] on columns
from
[adventure works]
where
(
[Product Filter].[Product Model Categories].[Model].&[Road-550-W],
[Customer].[City].&[Reading]&[ENG]
)
The query is simple, it lists products on the rows and profit on the columns, the ‘where’ clause slices by Reading, England and employs the new Product Filter dimension. The Product Filter dimension has the effect of slicing the main fact table by customers that have bought a bike from the Road 550-W range.
So, we can see that apart from the road bikes, a few other accessories have been purchased too. A quick couple of queries confirm the results.
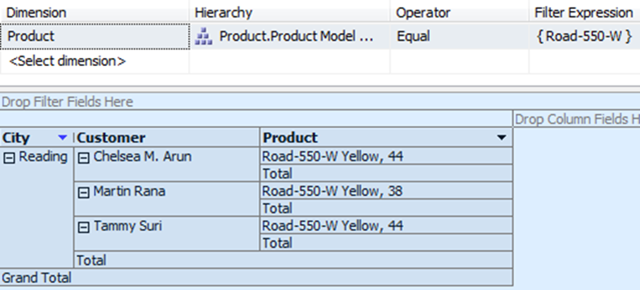
Three customers (above) have bought a road bike from the 550-W range and the other products these customers have bought (below) match our results !

Introduction to Data Wrangler in Microsoft Fabric
What is Data Wrangler? A key selling point of Microsoft Fabric is the Data Science
Jul
Autogen Power BI Model in Tabular Editor
In the realm of business intelligence, Power BI has emerged as a powerful tool for
Jul
Microsoft Healthcare Accelerator for Fabric
Microsoft released the Healthcare Data Solutions in Microsoft Fabric in Q1 2024. It was introduced
Jul
Unlock the Power of Colour: Make Your Power BI Reports Pop
Colour is a powerful visual tool that can enhance the appeal and readability of your
Jul
Python vs. PySpark: Navigating Data Analytics in Databricks – Part 2
Part 2: Exploring Advanced Functionalities in Databricks Welcome back to our Databricks journey! In this
May
GPT-4 with Vision vs Custom Vision in Anomaly Detection
Businesses today are generating data at an unprecedented rate. Automated processing of data is essential
May
Exploring DALL·E Capabilities
What is DALL·E? DALL·E is text-to-image generation system developed by OpenAI using deep learning methodologies.
May
Using Copilot Studio to Develop a HR Policy Bot
The next addition to Microsoft’s generative AI and large language model tools is Microsoft Copilot
Apr