Summary
Earlier this year, an article published by Forbes Online highlighted API’s as a potential driver to the digital economy. Companies like Salesforce.com generate up to 50% of their annual revenue through APIs.
I won’t go into the nitty gritty of what an API is or how it works, but here is an article by the Guardian to help with that.
Microsoft recently released new Power BI Template Solutions that allow ‘Newbie’ Power BI users the ability to create analytical dashboards to monitor the activity behind your company’s API’s, in a fast and simple way. This blog will hopefully show you how.
What is a Power BI solution template?
A Power BI template is basically an incredibly simple way to quickly create enterprise ready analytical dashboards.
You can use one of the currently available solution templates and have it up and running in around 30 minutes so that you and your team can quickly move onto more important tasks with the insights you’ve gained.
Why use a Microsoft Power BI Solution Template?
Here are a few reason as to why it may be worth your while to look into using a Power BI solution template:
- Quick and easy to get up and running.
- Several different templates to choose from with more to come.
- A lot of the templates are also free, however you will likely need to be set up with various Microsoft accounts in order to fully utilise some solutions.
- Customise your dashboard to better tell your story.
- Scale up as and when you need it.
How do I deploy an API management solution template?
Before we start, you will need to have a few things to hand.
- An Azure API Management instance (Link to the Microsoft Site to create an API Management Service)
- Power BI Desktop (latest version)
- Power BI Pro (For sharing with your organization)
You will also need an application to monitor.
Let’s start by going to Microsoft Power BI and navigate to the solutions tab. On the apps page, look for the ‘Azure API Management Analytics’ template and select ‘Get It Now’. You will be asked to sign into your Microsoft account after which you’ll be directed to the template start page.
There are 7 to be follow to build your solution.
Step 1 – Introduction and logon
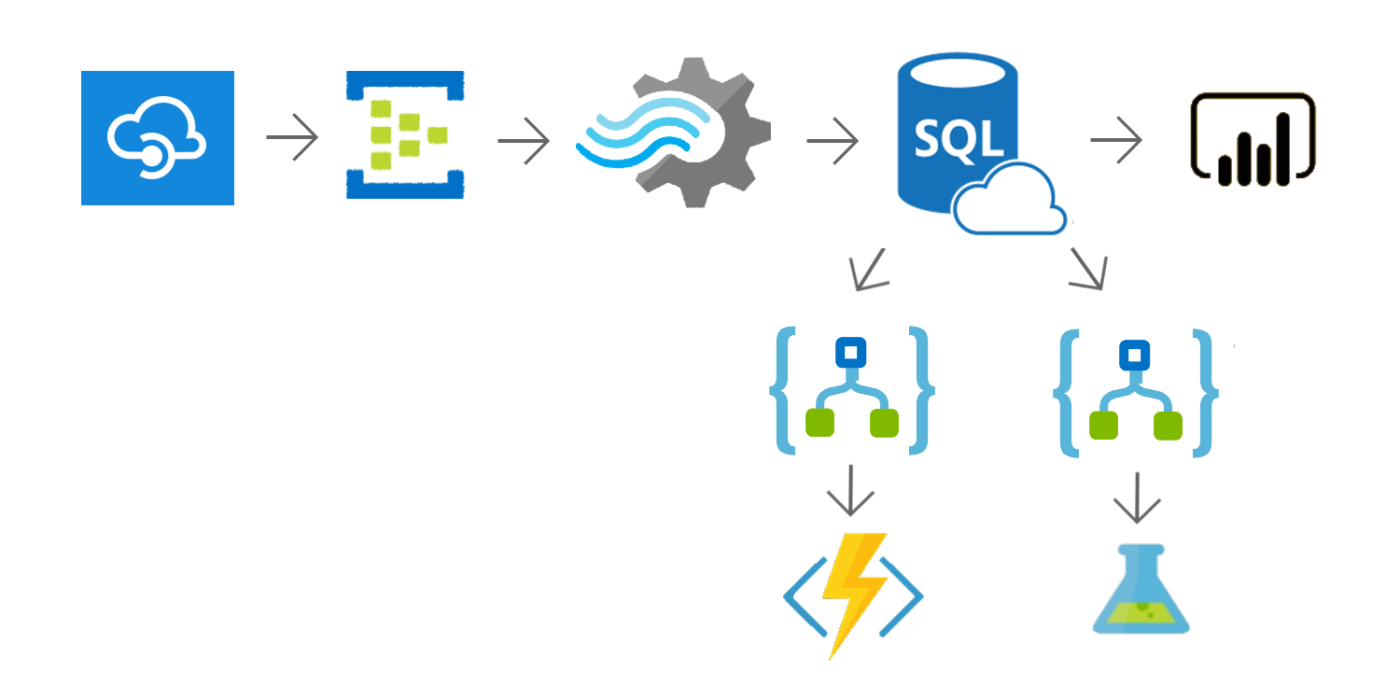
Here you will be shown the overall architecture of the API management solution.
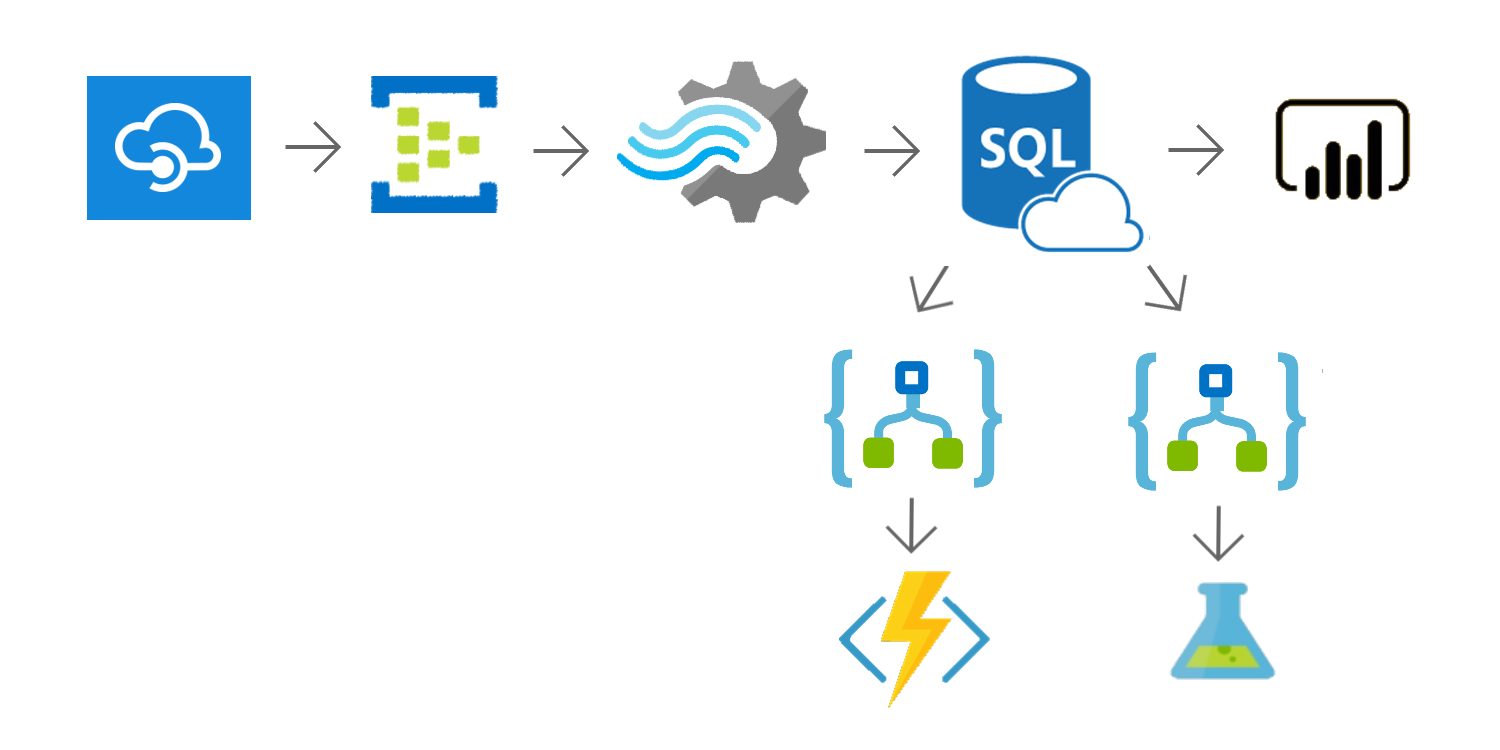
Features of the architecture:
- Stream API Request/Response data from API Management into Azure SQL
- Process API data with Azure ML & Azure Functions
- Connect to Azure SQL and import data into Power BI
At the bottom of the page, sign into your azure account.
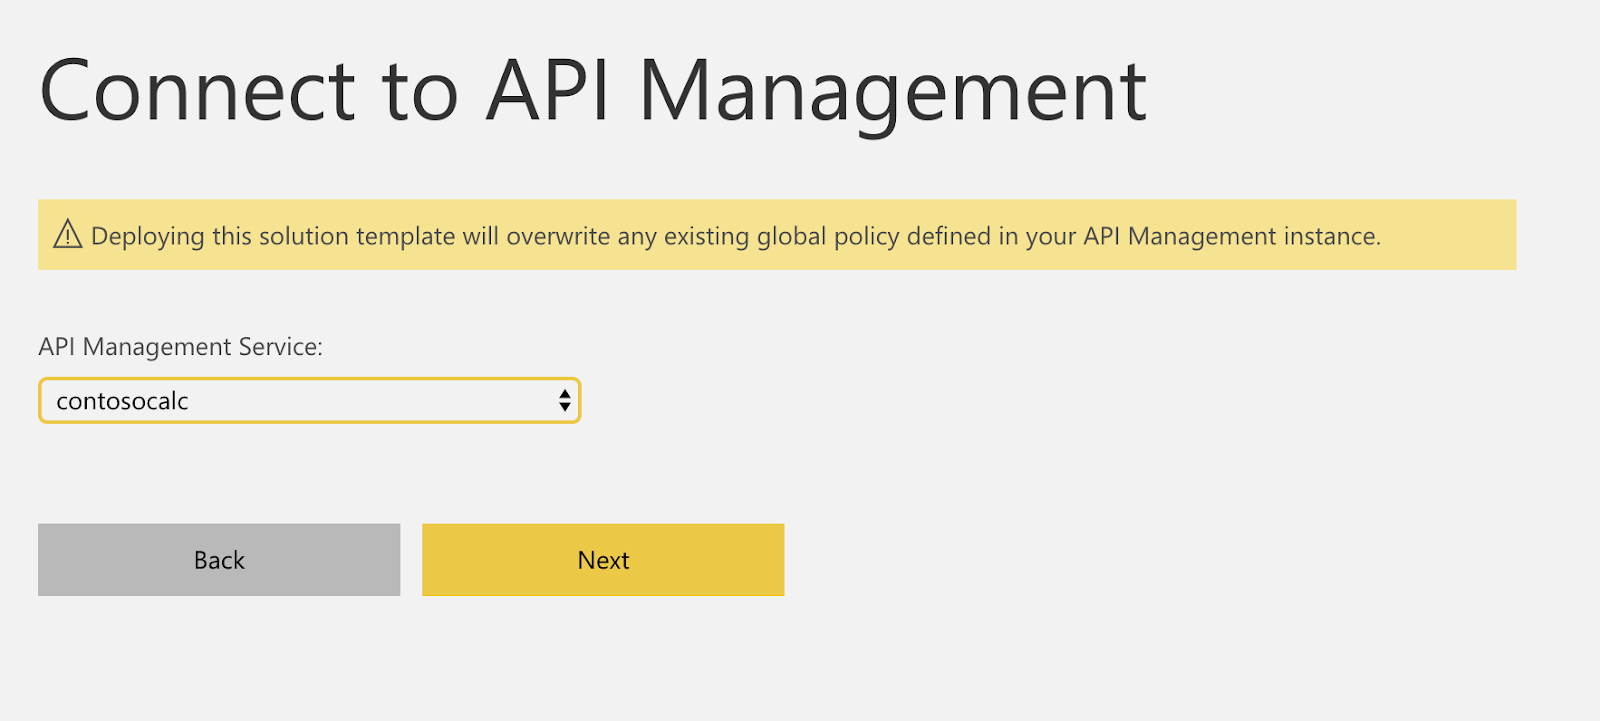
Step 2 – Connect to your API management service.
The drop down list should list the API management service you have either already created in Azure or you can use the above example of the API calculator if you need.
Step 3 – Where to store the API information.
You now need to connect to a Azure SQL instance. You can either decide to create a new instance or if you have one created already, you can choose to connect to it now.
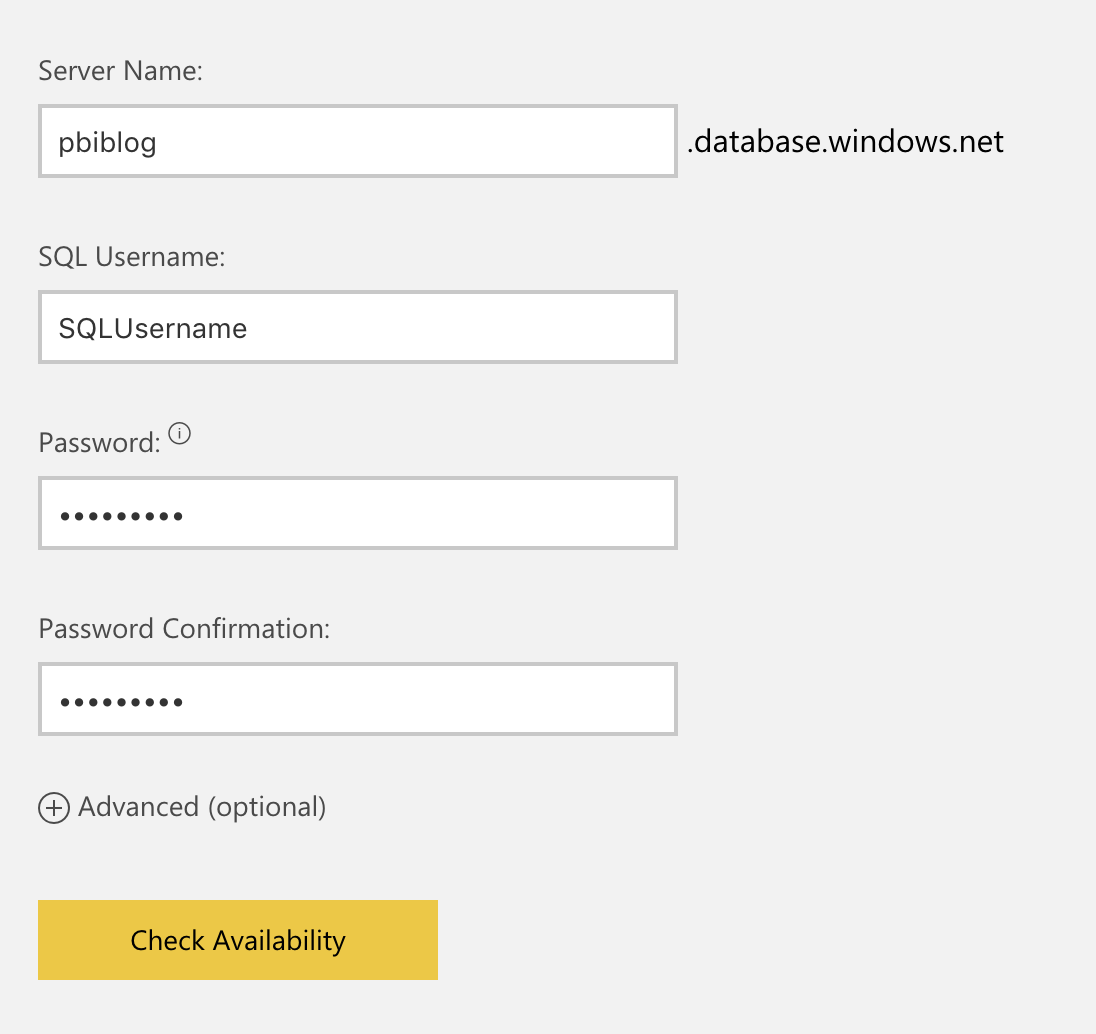
The above example creates a new SQL DB instance on azure. Fill out the necessary details and check that the server name has not already been used elsewhere.
Step 4 – Azure Analysis Services.
Azure Analysis Services a fully managed platform as a service (PaaS), integrated with Azure data platform services. We won’t need AAS to continue so we can skip to step 8.
Step 8 – Verify your template selection.
Confirm you have everything setup correctly.
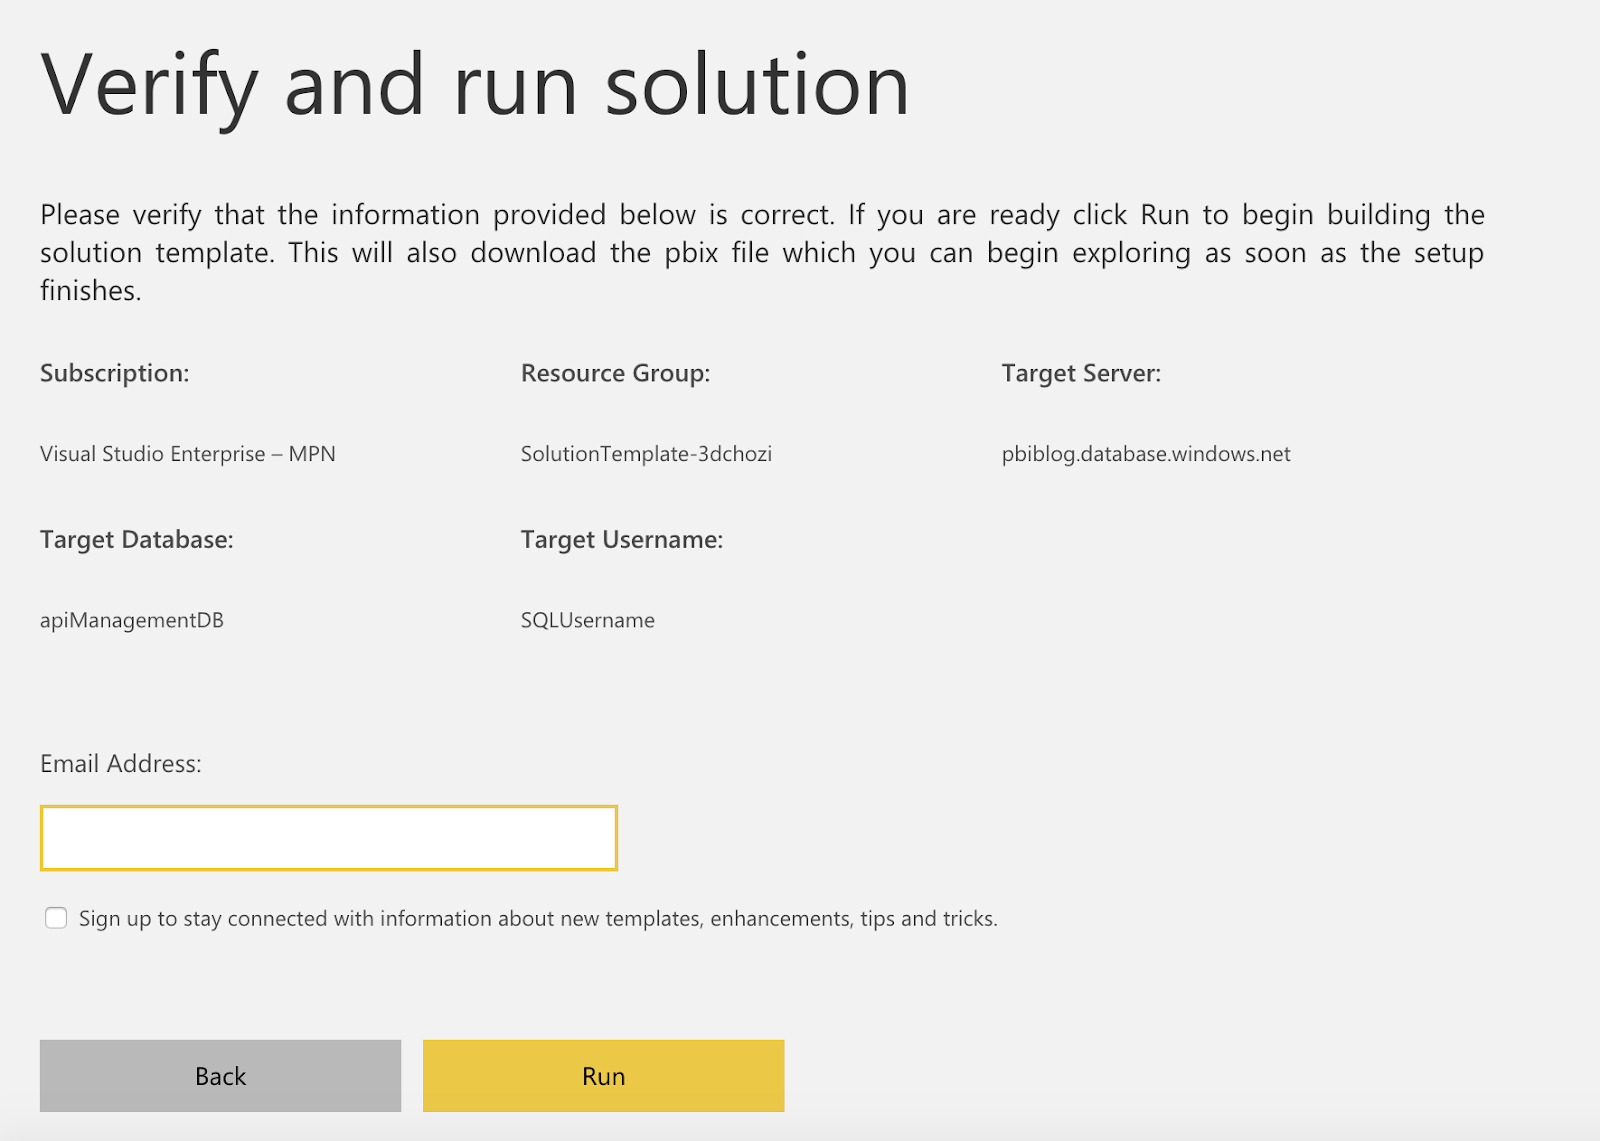
And lastly you simply need to deploy.
Step 9 – Deployment and template solution.
Using the above standard setup, the whole process took about 30 mins to deploy, after which a .pbix file is created.
What have you actually deployed?
What does ‘deploy’ actually mean? Below is a list of the resources that are automatically generated for the solution.
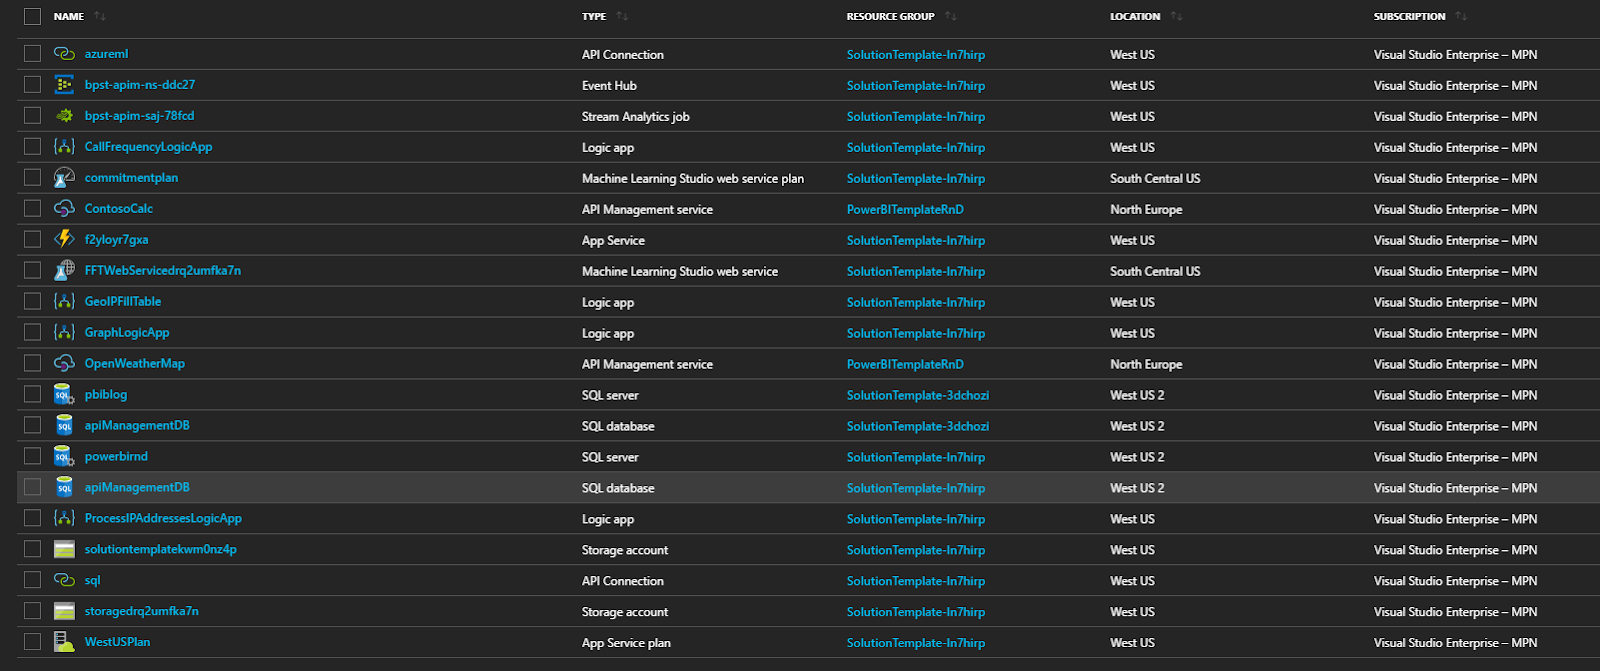
- Azure Event Hub
- Azure Stream Analytics
- Azure SQL (or you can use an existing instance)
- Azure Analysis Services (optional, additional cost, for high-scale deployments)
- 4 Logic Apps
- Function App containing 3 Functions
- Azure Machine Learning Web Service
All the above resources will be created under your azure account and charged to that account. This is where the template really comes into its own. All these resources are set up without you having to do anything more than sorting out a few naming conventions.
What does an API management solution look like?
Now that you’re all done setting up all the resources needed and you have your .pbix file ready. Open up Power BI Desktop and get your new template going.
On opening up the template, you will see a host of tabs. Start by going to the ‘Cover Page’ tab and here you will be told to edit your credentials.
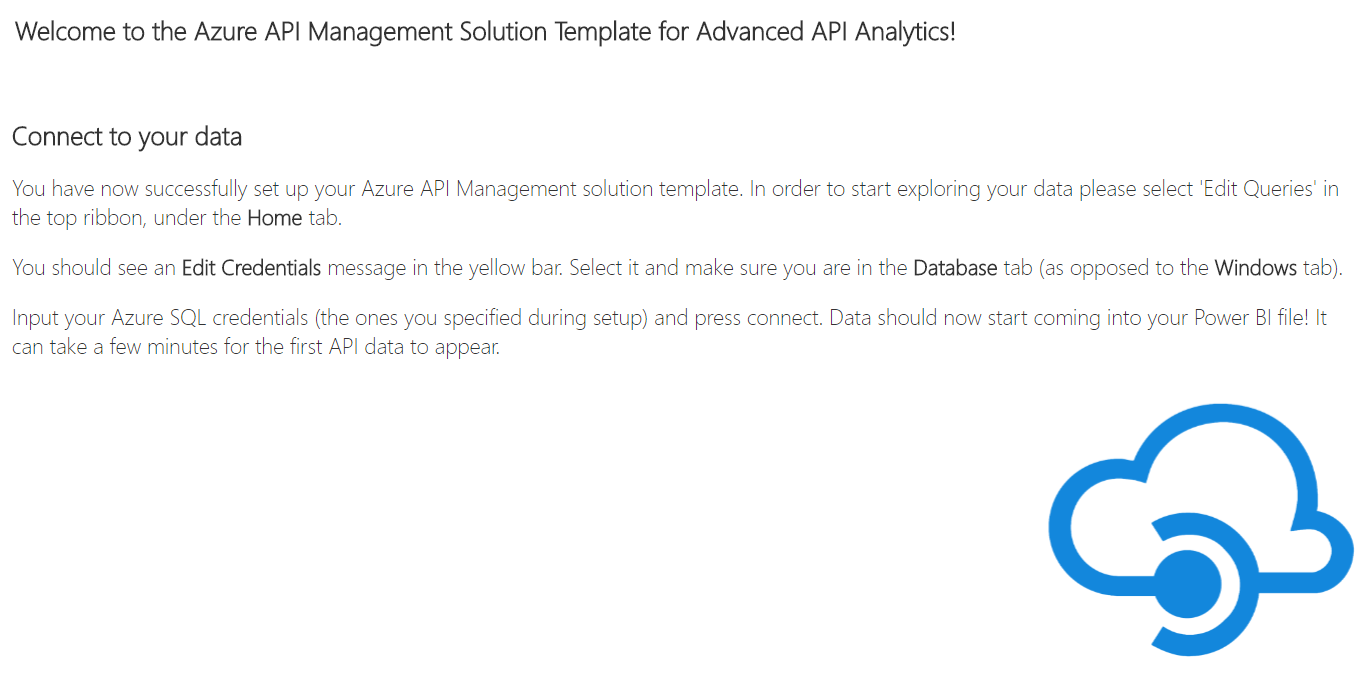
Editing your template credentials will connect you to the Azure DB resources you have just set up. You should shortly begin to see all the API data that you have. Bear in mind this currently means seeing everything you have from the point at which all your resources were set up. There is currently no way of getting historical data.
Hopefully, getting here should be pretty simple. Let’s now go through the reports available.
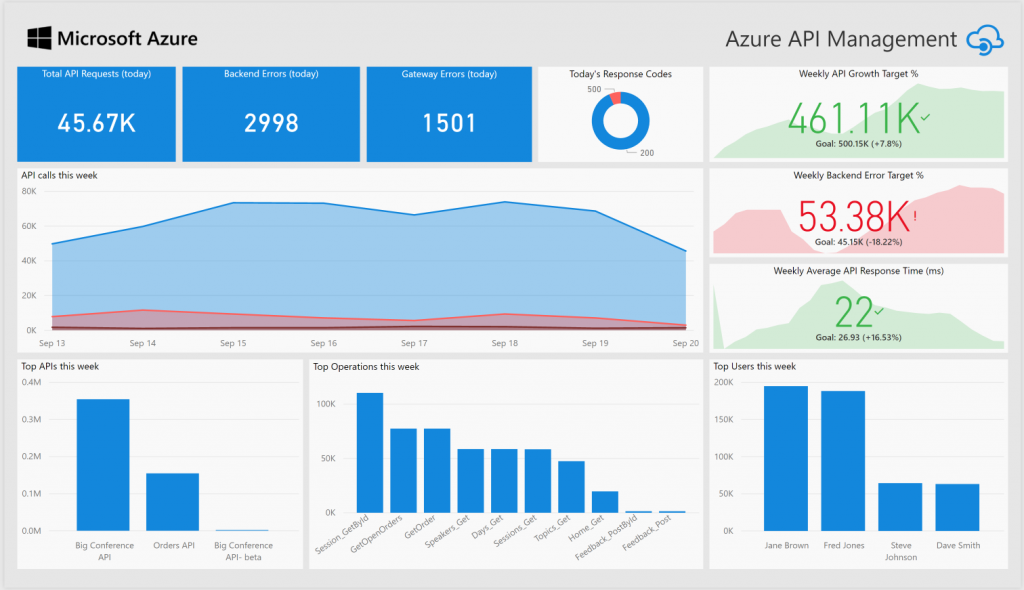
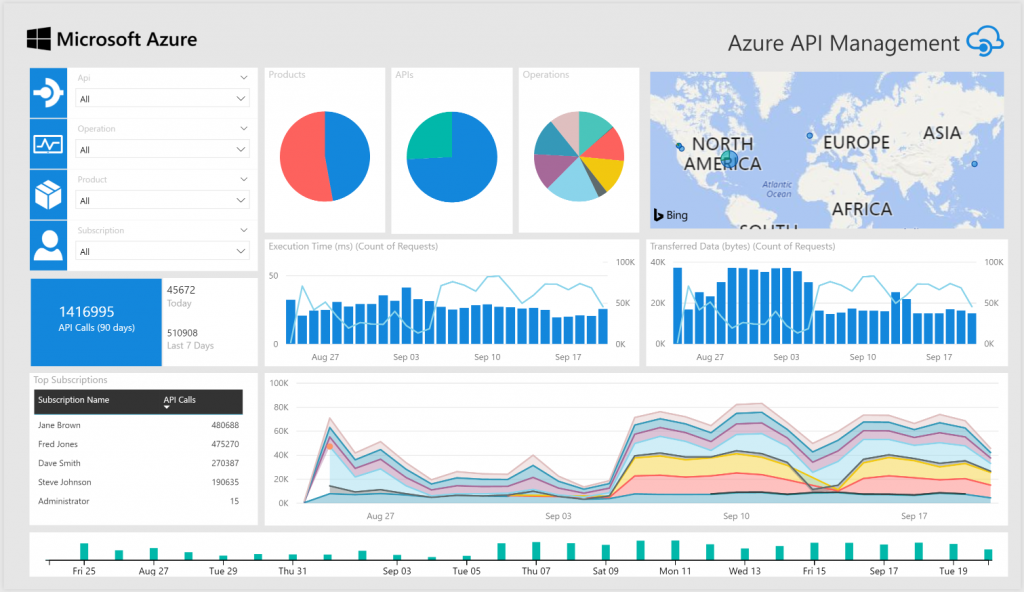
At a Glance.
A summary page of your APIs and their usage.
API Calls.
How long does it takes your APIs to respond. Where are these calls coming from and more specific data for you choosen API
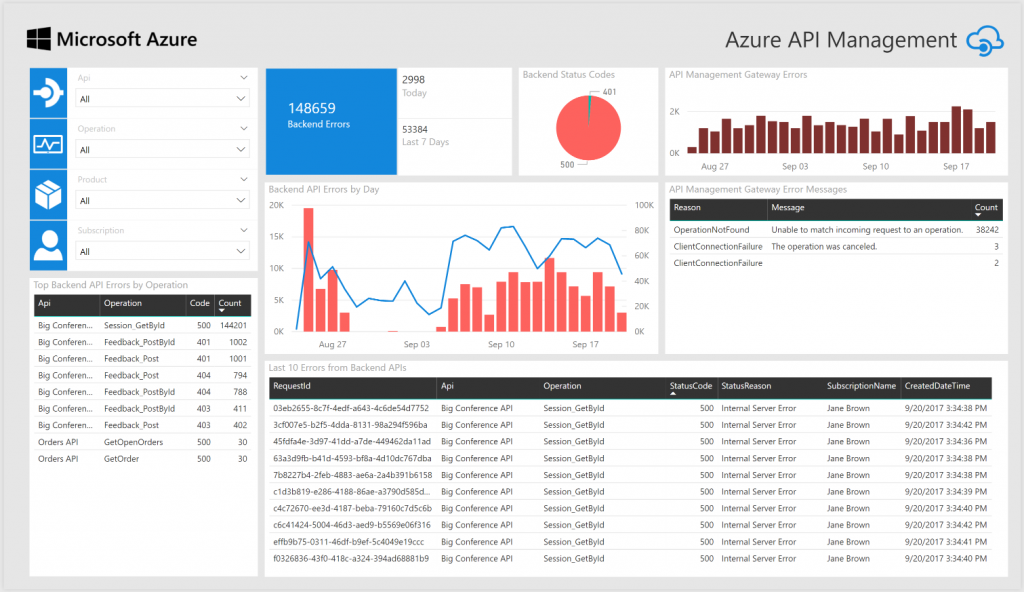
Errors.
As you can imagine, pretty important page and one you probably want to keep a close eye on.
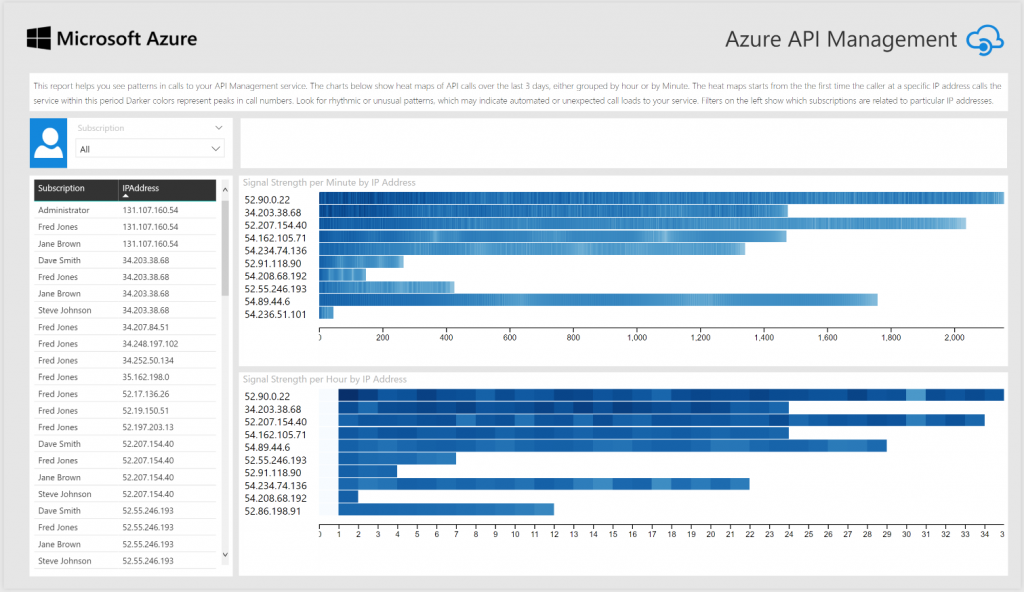
Call Frequency.
This page is useful to see how often your API’s are being called. You can see when and where the loads are on your APIs. This page allows you to see when your applications may be busy and where that traffic is coming come. This is also a good page to check to see if you have Bots making continuous calls to (or spamming) your API.
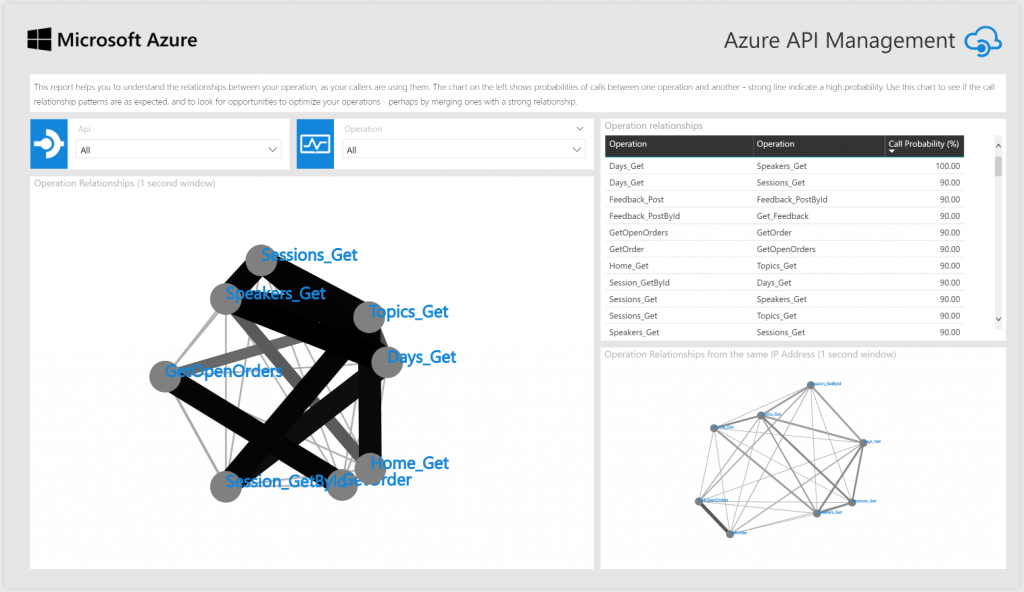
Relationships.
This page looks at how calls to your API are related, ie there may be two calls that are constantly happening at the same time. Maybe merging these two could optimize performance of your API….
What next….. Customisable?
As you can see there is a lot of information there for you to work with and all created for you through this simple to use template.
Now if you know a bit of Power BI, then amend the dashboard as needed. The queries behind everything can also be amended. If you are looking at more fields that you may want to report on, then that will require a bit more work. You will need to make sure the data is captured and stored in Azure SQL DB. You will then need to update the AllRequestData to return that field. Update your model, modify a report control, add the field to Stream Analytics request query and finally modify the Global Policy. So, it can be done, but may need a little bit more know how before you start.
A few things to be aware of.
- Currently, there is no way of including historical data so all you can see is what has happened from the moment the template is deployed.
- When I set up my template, I tried to set everything up as simple as possible, ie as cheap as possible and I would roughly say that it would cost $9 to $10 a day to keep all resources up and running.
- Currently the template does not support importing historical data. You will only see data from the point your resources were created.
- You will need Power BI desktop to use your template.
Introduction to Data Wrangler in Microsoft Fabric
What is Data Wrangler? A key selling point of Microsoft Fabric is the Data Science
Jul
Autogen Power BI Model in Tabular Editor
In the realm of business intelligence, Power BI has emerged as a powerful tool for
Jul
Microsoft Healthcare Accelerator for Fabric
Microsoft released the Healthcare Data Solutions in Microsoft Fabric in Q1 2024. It was introduced
Jul
Unlock the Power of Colour: Make Your Power BI Reports Pop
Colour is a powerful visual tool that can enhance the appeal and readability of your
Jul
Python vs. PySpark: Navigating Data Analytics in Databricks – Part 2
Part 2: Exploring Advanced Functionalities in Databricks Welcome back to our Databricks journey! In this
May
GPT-4 with Vision vs Custom Vision in Anomaly Detection
Businesses today are generating data at an unprecedented rate. Automated processing of data is essential
May
Exploring DALL·E Capabilities
What is DALL·E? DALL·E is text-to-image generation system developed by OpenAI using deep learning methodologies.
May
Using Copilot Studio to Develop a HR Policy Bot
The next addition to Microsoft’s generative AI and large language model tools is Microsoft Copilot
Apr