MLFlow is an open-source MLOps platform designed by Databricks to enable organisations to easily manage their end-to-end machine learning lifecycle.
What is MLOps?
MLOps is a framework that applies the principles of DevOps to the development of machine learning models. In the same way as DevOps, a successful application of MLOps allows organisations to unify and align developers of the ML systems with the operations team for the ML application. This framework uses continuous integration and deployment to enable close collaboration between these teams with continuous feedback and re-assessment of goals.
How does MLFlow enable MLOps?
The MLFlow platform facilitates continuous integration and deployment (CI/CD) by providing a simple platform to manage crucial CI/CD tasks – keeping track of experiments and iterative improvements, comparing and reproducing versions of code, and staged and controlled deployment of ML models.
MLFlow is installed by default on the Databricks Runtime for ML – you can identify these as any Databricks Runtimes with an “ML” suffix. It can leverage all of the scalability and big data processing capability of Spark and works with any ML library, language or existing code.
It consists of 4 core components:
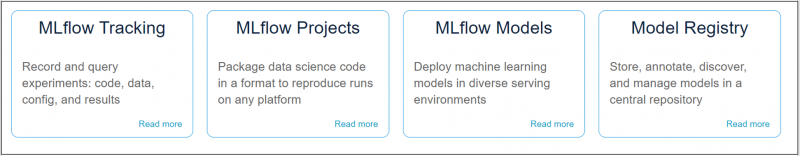
What is MLFlow Tracking?
MLFlow Tracking is the tool that allows us to log and query our runs and experiments during an ML development cycle.
- Runs are single executions of data science code.
- Experiments are logical groups of runs, typically corresponding to a particular data science project.
All of the functionality and data in MLFlow Tracking can be accessed through the Databricks UI or programmatically through the MLFlow API. It allows us to log and monitor things such as hyperparameter combinations, evaluation metrics and artifacts such as output visuals and the source code itself.
Demo
In this demonstration, we are going to show how the simple Databricks UI for MLFlow Tracking can be used to
- Create a run of machine learning algorithm within an experiment
- Track various runs within an experiment along with logged parameters, metrics and artifacts
- Compare our runs to find the best one and identify key drivers of model accuracy
Imagine we had the following data showing various attributes of a selection of wines:
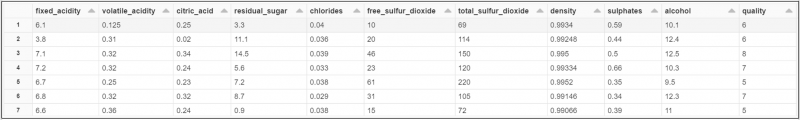
Having split the data into training and test datasets, let’s say we wanted to develop a model to predict the quality rating of a particular wine based solely on its percentage of alcohol.
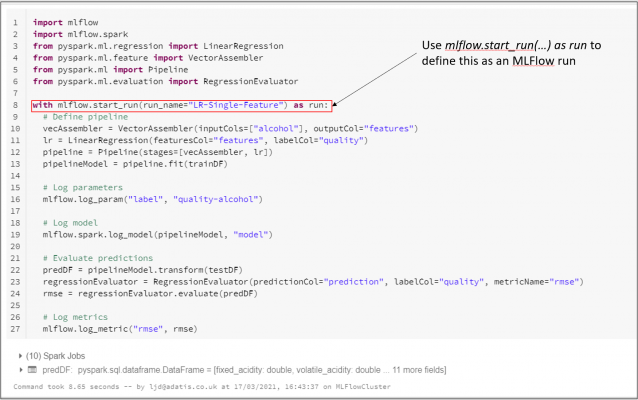
Let’s say we choose to generate a run which
- Trains a linear regression model to identify the relationship between alcohol and quality in our training dataset
- Uses this trained model to make predictions in our test dataset
- Evaluates these predictions in the test dataset against the actual results
The example below shows how we can define the first experimental run of our model using MLFlow Tracking:
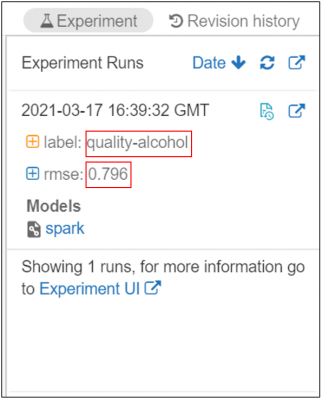
When the run has completed, you will notice that a notification will appear in the Experiments Pane in the top right of the screen.
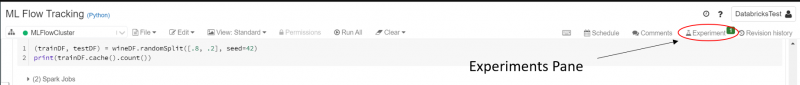
Once expanded, we can see that below that our run has been logged into this experiment, along with the label parameter and root mean square error (RMSE) evaluation metric that we have asked it to log. By default, each notebook will have its own defined experiment and all runs within the notebook will be logged to that experiment.
Now let’s say we do a second run, this time including all of the available fields in the data, except quality, as features. In this run, we log both R2 and RMSE evaluation metrics. Once complete, this run is added to the experiments pane.
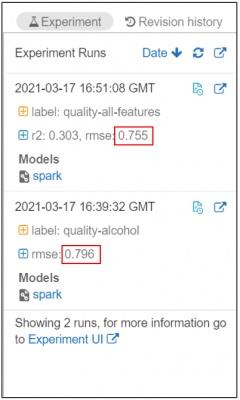
In the Experiments Pane, we are now able to see both runs and the logged metrics and parameters for each. Immediately, we can see that our RMSE has decreased on this second run from 0.796 to 0.755, indicating that the accuracy of our model has improved.
We can also click through to the Experiments UI to see an even greater range of options.
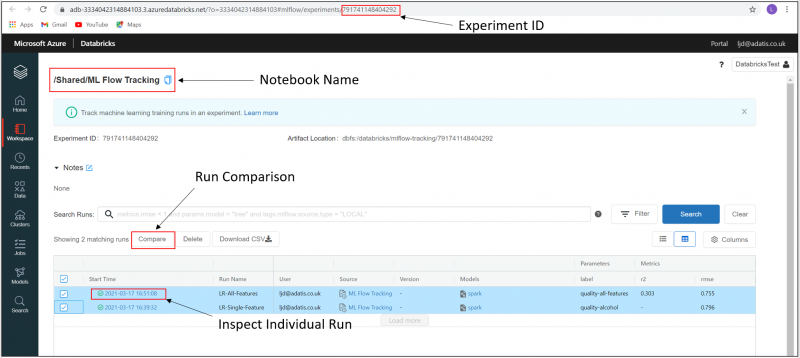
Here we can see all of our runs within this experiment listed, along with all of the logged metrics and parameters. We can query runs individually, reproduce runs, delete runs, or compare runs.
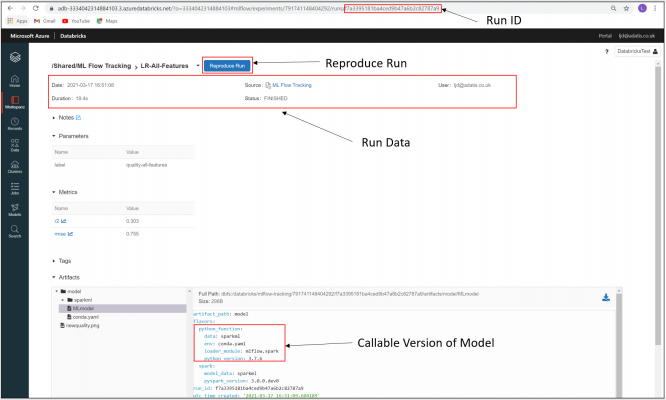
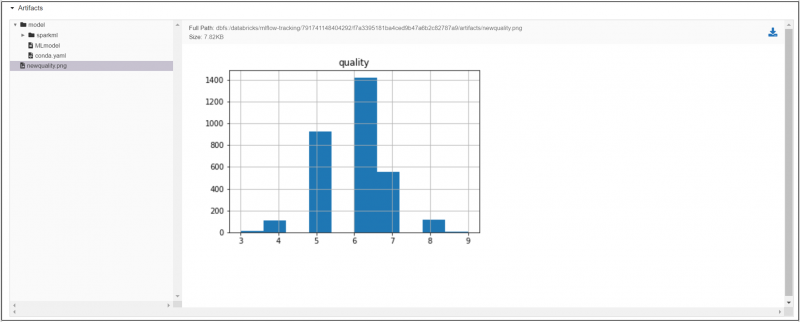
Clicking through to an individual run allows us to see further details about the run such as duration and status, as well as the logged artifacts.
One of the artifacts we have logged is the model itself. It is always logged with a “python function” flavour, which is a callable function, allowing users to reproduce previous runs of code. By selecting Reproduce Run, we can automatically reproduce the code used in the run in a Databricks notebook.
We are also able to log images and other types of files as artifacts. As part of this second run, we have logged a PNG artifact that displays the distribution of the quality ratings in a histogram.
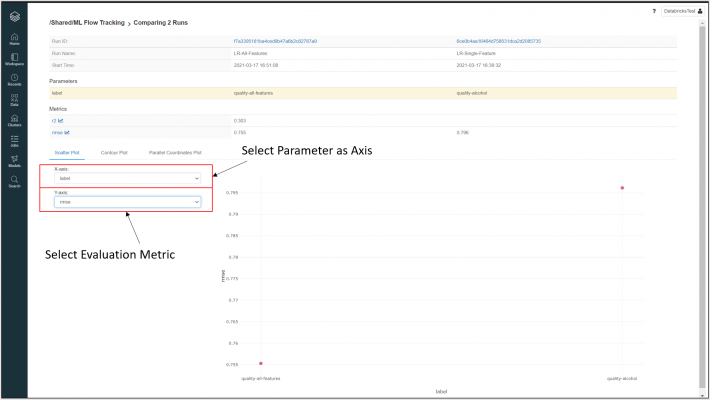
From the Experiments UI home page, by selecting “Compare” (highlighted in Experiments UI screenshot earlier), we can compare selected runs in more detail – including aggregating the evaluation metric outputs of various runs by assigned parameters and viewing in various graphical representations. This allows us to highlight certain key aspects or features of each model which may influence its accuracy.
In the example provided, we have assigned a label parameter to each model, and we can now see the RMSE metric values for each displayed on a scatter plot.
In conclusion…
Historically, keeping track of all your machine learning models throughout the experimentation process and continuously improving their accuracy was an extremely difficult task. With MLFlow Tracking, this process has become far simpler – developers can easily save and compare each run, identify key changes which could optimise their model, and reproduce previous runs of code.
Read part two of this blog – MLFlow: Introduction to Model Registry. If you have any questions, comments or feedback about any of the content of this blog, please feel free to reach out to me on LinkedIn.
Introduction to Data Wrangler in Microsoft Fabric
What is Data Wrangler? A key selling point of Microsoft Fabric is the Data Science
Jul
Autogen Power BI Model in Tabular Editor
In the realm of business intelligence, Power BI has emerged as a powerful tool for
Jul
Microsoft Healthcare Accelerator for Fabric
Microsoft released the Healthcare Data Solutions in Microsoft Fabric in Q1 2024. It was introduced
Jul
Unlock the Power of Colour: Make Your Power BI Reports Pop
Colour is a powerful visual tool that can enhance the appeal and readability of your
Jul
Python vs. PySpark: Navigating Data Analytics in Databricks – Part 2
Part 2: Exploring Advanced Functionalities in Databricks Welcome back to our Databricks journey! In this
May
GPT-4 with Vision vs Custom Vision in Anomaly Detection
Businesses today are generating data at an unprecedented rate. Automated processing of data is essential
May
Exploring DALL·E Capabilities
What is DALL·E? DALL·E is text-to-image generation system developed by OpenAI using deep learning methodologies.
May
Using Copilot Studio to Develop a HR Policy Bot
The next addition to Microsoft’s generative AI and large language model tools is Microsoft Copilot
Apr