I recently delivered an Analysis Services training course to a client who were a bit surprised to learn that the standard list of Aggregation Functions for an Analysis Services measure doesn’t include Mean, Median and Mode. My answer was of course that all three can delivered using MDX, so I thought it might be a good blog post to show how it’s done.
Before I begin, just a quick refresher for anyone who needs it, the following article seems to be a good reference on the difference between Mean, Median and Mode. Essentially Mean is the average, Median is the middle value, whereas Mode is the value that occurs the most.
Mean and Median
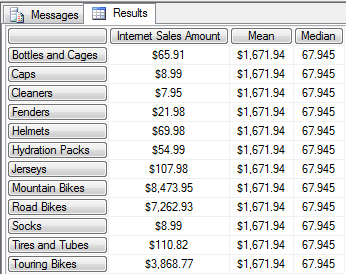
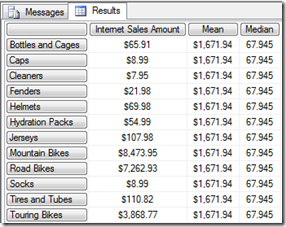
The Mean and the Median are both relatively easy to do in MDX as there are built-in functions for both AVG() and Median(). As they’re well documented here and here, I won’t spend too long covering them. In the following MDX query I’m producing the Mean and the Median of the product sub categories in Adventure Works:
WITH
MEMBER  [Measures].[Mean] AS AVG([Product].[Subcategory].[Subcategory].Members,
        [Measures].[Internet Sales Amount])

MEMBER  [Measures].[Median] AS Median([Product].[Subcategory].[Subcategory].Members,
        [Measures].[Internet Sales Amount])

SELECT  {[Measures].[Internet Sales Amount], [Measures].[Mean], [Measures].[Median]} ON 0,
        NonEmpty([Product].[Subcategory].[Subcategory].Members, [Measures].[Internet Sales Amount]) ON 1
FROM    [Adventure Works]
WHERE   ([Date].[Date].&[20070727])
If you run the query and copy the data out to Excel you’ll see that it matches the result of Excel’s Median and Mode functions.
Mode
Mode is harder to achieve as there’s no built in MDX function. Fortunately, Excel is on hand to help out, as Analysis Services allows you to use some of the Excel functions in MDX. There are warnings that come with this approach, as you need to have Excel installed on the server and there can also be performance problems. But, if you’re comfortable with these caveats, then the Excel mode function may be an option for you.
If you do use the Excel Mode function then there are a few things to watch out for. Firstly, you’ll have to use the MDX SetToArray() function to pass the set in the format that Excel expects. Secondly, you may get an error returned with the description: “#Error The following system error occurred: Invalid flags.” This is due to the data type of the Measure – it seems that Currency measures are not supported by this function. Therefore, I’m using Cdbl() on Internet Sales Amount to get this to work:
WITH
MEMBER  [Measures].[Demo] AS Cdbl([Measures].[Internet Sales Amount])

MEMBER  [Measures].[ExcelMode] AS
        Excel!MODE(SetToArray(NONEMPTY([Product].[Subcategory].[Subcategory].Members, [Measures].[Demo])
        * [Measures].[Demo]))
Applying this to the example query I’ve got above, the mode returned is 8.99, as its the only number that appears twice.
Bi Modal Result Set
There is a bit more complexity to Mode in some situations, essentially as you can get a bi-modal result set – where there is more than one value occurring the most. E.g. the mode of 1,2,2,3 is just 2, but the mode of 1,2,2,3,3,4 is both 2 and 3 – so it’s known as bi-modal.
The Excel Mode function won’t help in this scenario, as it will just return one of the mode values. Interestingly Excel 2010 does support this, with the Mode.Mult() function, but I’ve been unable to get this to work, presumably as the Excel function returns an array.
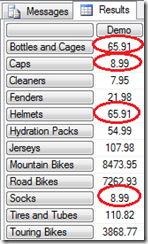
All is not lost though, it’s possible to produce mode using MDX. First of all, the numbers that I’m operating on are shown below. As you can see, there are two sets of two numbers that are the same:
As the following forum thread shows, mode can be achieved using MDX. I’m adapting that approach to give the following MDX:
WITH
--Produce a result set that will guarantee bi modal results
MEMBER    [Measures].[Demo] AS
        CASE WHEN [Product].[Subcategory].CurrentMember IS [Product].[Subcategory].&[31]  THEN 65.91
        ELSE Cdbl([Measures].[Internet Sales Amount]) END

--Count how often each value appears
MEMBER [Measures].[ValueCount] AS
SUM(
    Union([Product].[Subcategory].CurrentMember.Level.Members,
        {[Product].[Subcategory].CurrentMember} AS Currentsub)
    , IIF(([Product].[Subcategory].CurrentMember, [Measures].[Demo]) =
        (Currentsub.Item(0).Item(0), [Measures].[Demo]), 1, null)
)
--Only get the items that appear the most
SET [MaxModes] AS
    ORDER(FILTER(NONEMPTY([Product].[Subcategory].[Subcategory].Members, {[Measures].[Demo]}),
    [Measures].[ValueCount] = MAX(NONEMPTY([Product].[Subcategory].[Subcategory].Members, [Measures].[Demo]),
        [Measures].[ValueCount])), [Measures].[Demo], ASC)

SELECT   {[Measures].[Demo], [Measures].[ValueCount]} on 0,
        [MaxModes]
        --Filter out the duplicates
        HAVING [MaxModes].CurrentOrdinal = 0 OR [Measures].[Demo] <>
            ([Measures].[Demo], [MaxModes].Item([MaxModes].CurrentOrdinal - 2)) ON 1
FROM    [Adventure Works]
WHERE    ([Date].[Date].&[20070727])
This gives the following correct result set, assuming we just want the two bi modal values:
An alternative is to use an MDX Filter() or HAVING clause to just display all the sub categories that have the mode values, which would just require a small modification to the above code.
I’ve not used these approaches with big data volumes etc, but they should at least give you a few options if you’ve got to do these sort of calculations in your own environment.


Introduction to Data Wrangler in Microsoft Fabric
What is Data Wrangler? A key selling point of Microsoft Fabric is the Data Science
Jul
Autogen Power BI Model in Tabular Editor
In the realm of business intelligence, Power BI has emerged as a powerful tool for
Jul
Microsoft Healthcare Accelerator for Fabric
Microsoft released the Healthcare Data Solutions in Microsoft Fabric in Q1 2024. It was introduced
Jul
Unlock the Power of Colour: Make Your Power BI Reports Pop
Colour is a powerful visual tool that can enhance the appeal and readability of your
Jul
Python vs. PySpark: Navigating Data Analytics in Databricks – Part 2
Part 2: Exploring Advanced Functionalities in Databricks Welcome back to our Databricks journey! In this
May
GPT-4 with Vision vs Custom Vision in Anomaly Detection
Businesses today are generating data at an unprecedented rate. Automated processing of data is essential
May
Exploring DALL·E Capabilities
What is DALL·E? DALL·E is text-to-image generation system developed by OpenAI using deep learning methodologies.
May
Using Copilot Studio to Develop a HR Policy Bot
The next addition to Microsoft’s generative AI and large language model tools is Microsoft Copilot
Apr