Sometimes when using SSRS to create documents such as invoices, it is necessary to include columns in a table which may or may not be shown. Often with these documents layout is very important, and having a table changing width as columns are shown or hidden is unacceptable. It is not possible in SSRS to give a table a fixed width, but we can use another method to simulate this without having to dig into the RDL file.
We’ll make a report that contains a table made up of 5 columns:
| Product (Static) |
Colour (Variable) |
Weight (Variable) |
Delivery Date (Variable) |
Price (Static) |
Columns labelled as ‘static’ are always shown on the report, and those labelled ‘variable’ may be optionally shown or hidden by the user at run-time. In order to make it appear that the table maintains a constant width when some columns are hidden
Test Data
First we need some test data for out report. Use the following script to set up a small table and sample data for use in the example:
1: CREATE TABLE [dbo].[InvoiceProducts]
2: ( Product VARCHAR(20) NOT NULL,
3: Colour VARCHAR(10) NOT NULL,
4: Weight NUMERIC(10,2) NOT NULL,
5: DeliveryDate DATETIME NULL,
6: Price NUMERIC(10,2) NOT NULL);
7:
8: INSERT INTO [dbo].[InvoiceProducts] VALUES ('Milk','White',1500,'2013-05-13',1.45);
9: INSERT INTO [dbo].[InvoiceProducts] VALUES ('Beans','Orange',450,NULL,0.75);
10: INSERT INTO [dbo].[InvoiceProducts] VALUES ('Eggs','Yellow',500,'2013-06-01',1.75);
Creating the Report
Open Visual Studio and create a new blank SSRS report. Add a data source connection to the database where you created the InvoiceProducts table, then create a new data set using:
1: SELECT
2: Product
3: ,Colour
4: ,Weight
5: ,DeliveryDate
6: ,Price
7: FROM
8: dbo.InvoiceProducts
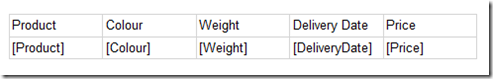
Add a table to the report body, then map the data set fields to the table in the order of the SELECT statement. Your table should look like this:

Next we need to add parameters to control the visibility on the Colour, Weight and Delivery Date columns. These should be set to a type of ‘boolean’ with the default value set to true. Finally, set the visibility on each of the variable columns to be controlled by the parameters you’ve just added. To do this, left-click into one of the column cells, then right-click on the solid grey bar above the column header. Select ‘column visibility’, then select the radio button labelled ‘Show or hide based on an expression’. Click the ‘Fx’ button to bring up the expression editor, then enter an expression like:
1: =Not(Parameters!ShowColour.Value)
Do this for each of the columns for which we need to control the visibility, using the appropriate parameter for each column.
If we test the report now, firstly with all of our parameters set to ‘true’ we should see all the columns:

Now set the ‘Show Colour’ parameter to false and run again. The column is hidden and the table width is reduced by the column width:

To prevent this behaviour and maintain a constant table width, we need to insert and extra blank column for each column that may be conditionally hidden. In the designer, insert 3 columns to the left of the ‘Colour’ column:

By setting the ‘column visibility’ properties of these columns to give the opposite effect to the columns containing our data, we can add a blank column for each data column we hide and thus maintain total table width (given that the widths of a blank column and its corresponding data column are the same). Starting with the left-most blank column, set the column visibility property to:
1: =Parameters!ShowColour.Value
Set the other blank columns visibility using the parameters for weight and delivery date. The effect is the when one of the parameters is set to ‘false’ (i.e. do not show the column), the data column will be hidden, but a blank column of the same width will be shown. With suitable formatting, this will be invisible to the end user and will give the impression that the table width stays the same. Below shows the report with all columns showing, and then with the colour column hidden:


You could merge the ‘Product’ data cells with the blank cells between it and the ‘Colour’ data cells and this would allow the product data to expand to fill the blank column. As far as the end user is concerned, the product column has simply gotten wider.
Conclusion
For occasions when precision layout is important, maintaining the width of a table that contains optionally hidden columns may be necessary. Using the method outlined in this post, I have shown how it is relatively easy to achieve this using standard SSRS components and simple expressions. This is a much more sustainable solution than editing the RDL of a report at run-time!
Introduction to Data Wrangler in Microsoft Fabric
What is Data Wrangler? A key selling point of Microsoft Fabric is the Data Science
Jul
Autogen Power BI Model in Tabular Editor
In the realm of business intelligence, Power BI has emerged as a powerful tool for
Jul
Microsoft Healthcare Accelerator for Fabric
Microsoft released the Healthcare Data Solutions in Microsoft Fabric in Q1 2024. It was introduced
Jul
Unlock the Power of Colour: Make Your Power BI Reports Pop
Colour is a powerful visual tool that can enhance the appeal and readability of your
Jul
Python vs. PySpark: Navigating Data Analytics in Databricks – Part 2
Part 2: Exploring Advanced Functionalities in Databricks Welcome back to our Databricks journey! In this
May
GPT-4 with Vision vs Custom Vision in Anomaly Detection
Businesses today are generating data at an unprecedented rate. Automated processing of data is essential
May
Exploring DALL·E Capabilities
What is DALL·E? DALL·E is text-to-image generation system developed by OpenAI using deep learning methodologies.
May
Using Copilot Studio to Develop a HR Policy Bot
The next addition to Microsoft’s generative AI and large language model tools is Microsoft Copilot
Apr