I recently had a request from a client who wanted to display use a parent child hierarchy to navigate their report.
The issue with this however is when you click the hierarchy the report refreshes, the data is updated in the charts, but the hierarchy collapses to its original state as below. This wasn’t suitable for the clients needs as it was a large hierarchy with several levels of depth.


What was required was to maintain the state of the hierarchy so it would stay expanded during report refresh.
After a little thought I came up with the following solution:
1. Setup a standard report with an indented hierarchy with expandable sections. This has been covered in many places so I’ll only give a brief overview, for this example report I have used adventure works multidimensional model with the following MDX query as the source for the hierarchy data:-

Add the fields in a matrix like this:

Right click the Organizations text box, select ‘Textbox Properties’ and in the Alignment tab set the Left padding property to the following value (change the number to adjust indentation):

Following this you need to setup groupings in order for the expanding hierarchy. Add a grouping on the UniqueName property

On the visibility section set the toggle property to HIDE (ignore the expression for now -) and set the “‘Display can be toggled by this report item” property as per the below.

In the advanced section set the recursive parent property to [Organisations.ParentUniqueName] and this should give a working report with an expandable hierarchy.

2. Add a hidden parameter to the report called OrganisationLevel. Set the default value to the top of the hierarchy.

Add another column to the matrix, add text to it for the link.

Select the text and right-click the selected text navigate to properties and place an action to go to original report and pass the OrganisationLevel parameter with a value of [Organisations.UniqueName]

3. Add a dataset dsHierarchyVisibleMembers with the below MDX query – this query uses the OrganisationLevel parameter to work out which level in the hierarchy the user has clicked on and the entities at the same level which we can then use to control the state of the expanding hierarchy.

Now set the visibility property on the row grouping to the following value:

The last step is to set the hierarchy collapsed/expanded state, which we using the following formula for the ‘InitialToggleState’ property of the text box to the following.

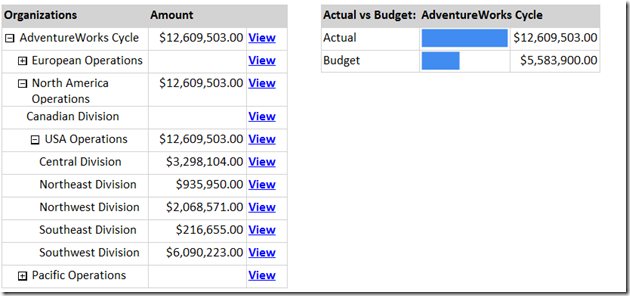
Once these steps are completed clicking one of the elements in the report will pass the parameter, but the hierarchy state is maintained between clicks. Clicking View on ‘Northeast Division’ the left report displays the following in the right – note the chart has been updated but that the hierarchy expansion state remains as it was before the user clicked.


That’s all for now, hope this is of use.
Introduction to Data Wrangler in Microsoft Fabric
What is Data Wrangler? A key selling point of Microsoft Fabric is the Data Science
Jul
Autogen Power BI Model in Tabular Editor
In the realm of business intelligence, Power BI has emerged as a powerful tool for
Jul
Microsoft Healthcare Accelerator for Fabric
Microsoft released the Healthcare Data Solutions in Microsoft Fabric in Q1 2024. It was introduced
Jul
Unlock the Power of Colour: Make Your Power BI Reports Pop
Colour is a powerful visual tool that can enhance the appeal and readability of your
Jul
Python vs. PySpark: Navigating Data Analytics in Databricks – Part 2
Part 2: Exploring Advanced Functionalities in Databricks Welcome back to our Databricks journey! In this
May
GPT-4 with Vision vs Custom Vision in Anomaly Detection
Businesses today are generating data at an unprecedented rate. Automated processing of data is essential
May
Exploring DALL·E Capabilities
What is DALL·E? DALL·E is text-to-image generation system developed by OpenAI using deep learning methodologies.
May
Using Copilot Studio to Develop a HR Policy Bot
The next addition to Microsoft’s generative AI and large language model tools is Microsoft Copilot
Apr