Before I started writing this blog, I went to Google and searched for the keywords Digital Twins. The result: 271 000 000 pages. Then, I decided to narrow my search and used the keywords Azure Digital Twins. In return, I got a modest 2 220 000 results. So you wonder, if there is already so much content around this subject, why did I bother to write yet another blog covering Digital Twins? The answer is very simple. When I started this journey, I was overwhelmed with the amount of information available, however, I kept coming to the same question: how does Digital Twins fit in the data analytics world and how can you build one? In this blog I’ll demonstrate how we, at Adatis, built our first Digital Twin.
If you are completely new to this world, a Digital Twin is a virtual replica of a physical product, process or system, such as a pump, a car, a building, a factory or a production itself. A Digital Twin is a concept that becomes reality when combined with a series of technologies, such as IoT, Machine Learning and AI.
Now that you know the basics, you may wonder, how can you build your own Digital Twin. There are a few different options, however, I’ll focus on the Microsoft offering, Azure Digital Twins, “a service that provides ready-to-use building blocks that can simplify the creation of detailed, comprehensive digital models that bring solutions to life”. You can read more about it here.
Step 1
The first thing to do when building a Digital Twin is to understand what is the problem you want to solve and the function (eg. is it simply to monitor an asset or to control and alter the asset?). In this case, we would like to leverage the capabilities of a smart building to help us improve our energy efficiency and have a better occupancy management. We defined 4 main KPIs:
- Average Temperature, Humidity and Air Quality
- Occupancy – This was particularly important during COVID because we were enforcing social distancing and reducing capacity in our meeting rooms
Step 2
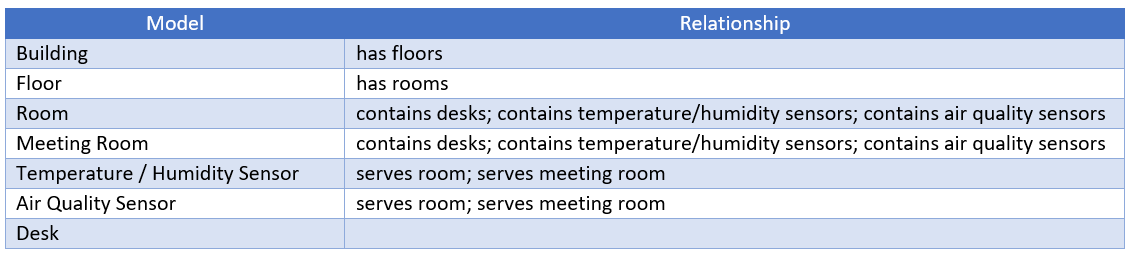
Create a model that represents the physical asset, specifying the objects and relationships. In this particular scenario we have the following representation:
Step 3
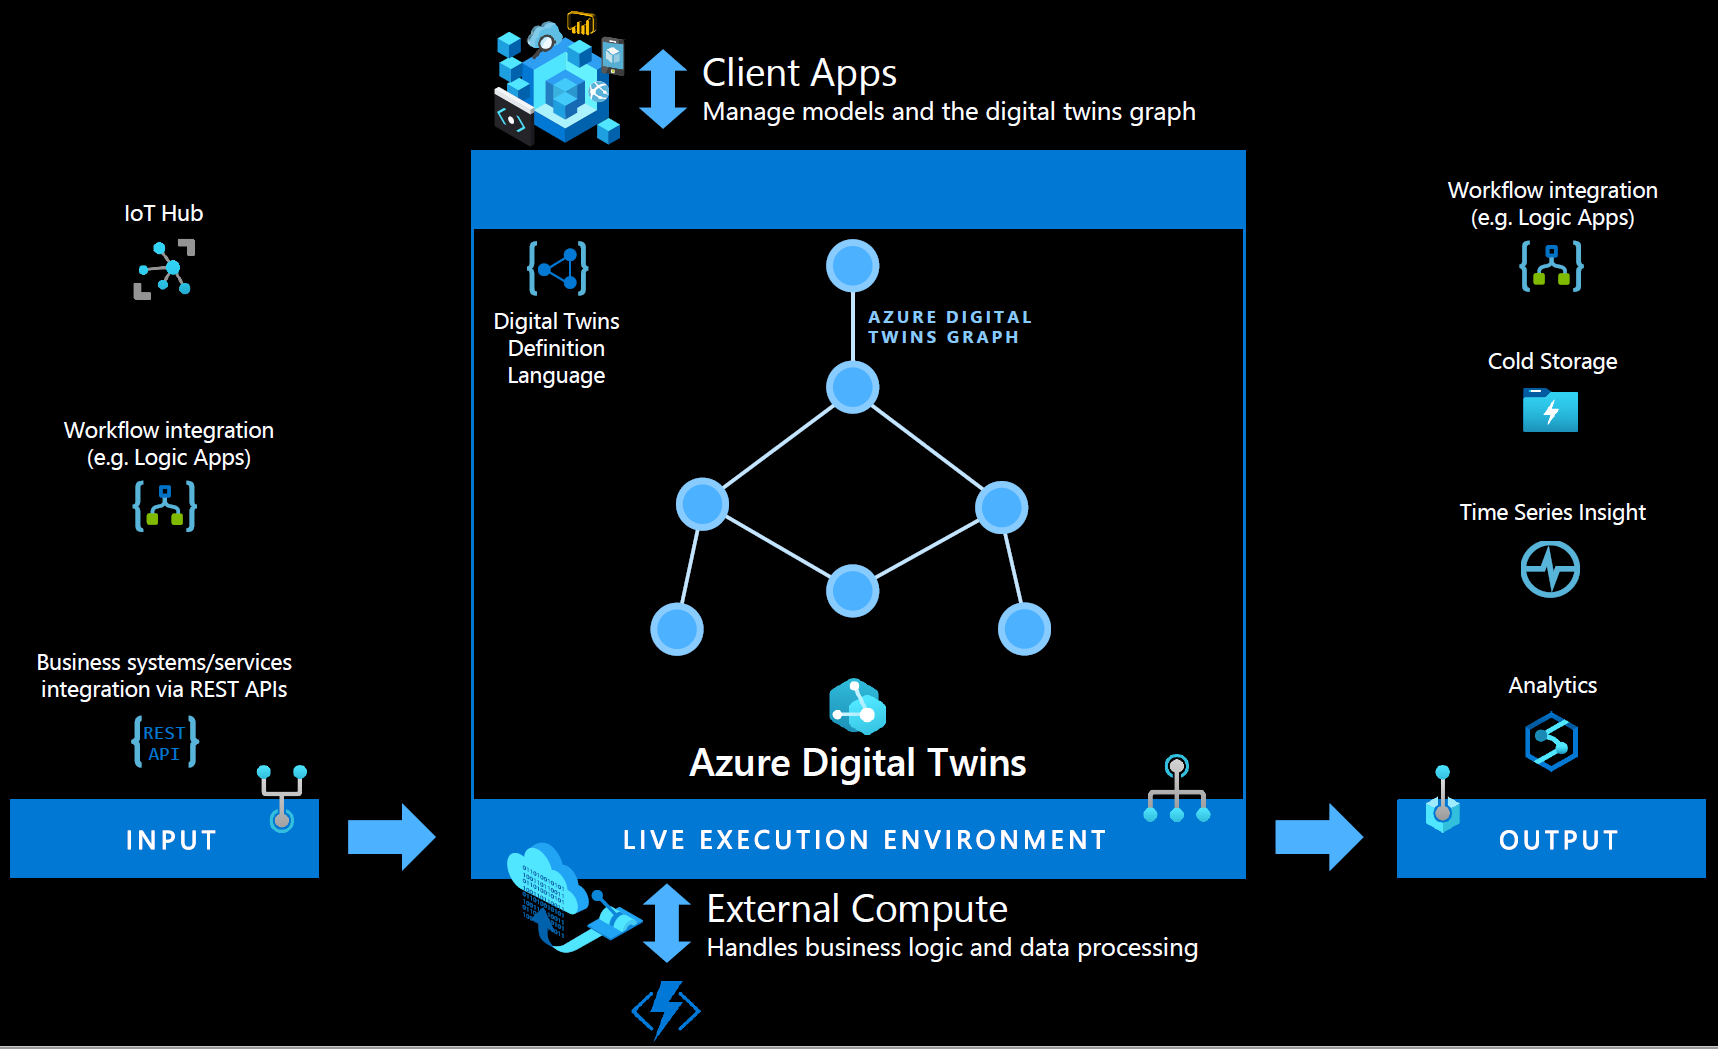
Select the enabling technology needed to integrate the physical asset within its digital twin to enable the real-time flow of data from the IoT devices and integration with operational and transactional information from other enterprise systems.
The below architecture demonstrates Microsoft’s approach to the problem.
Step 4
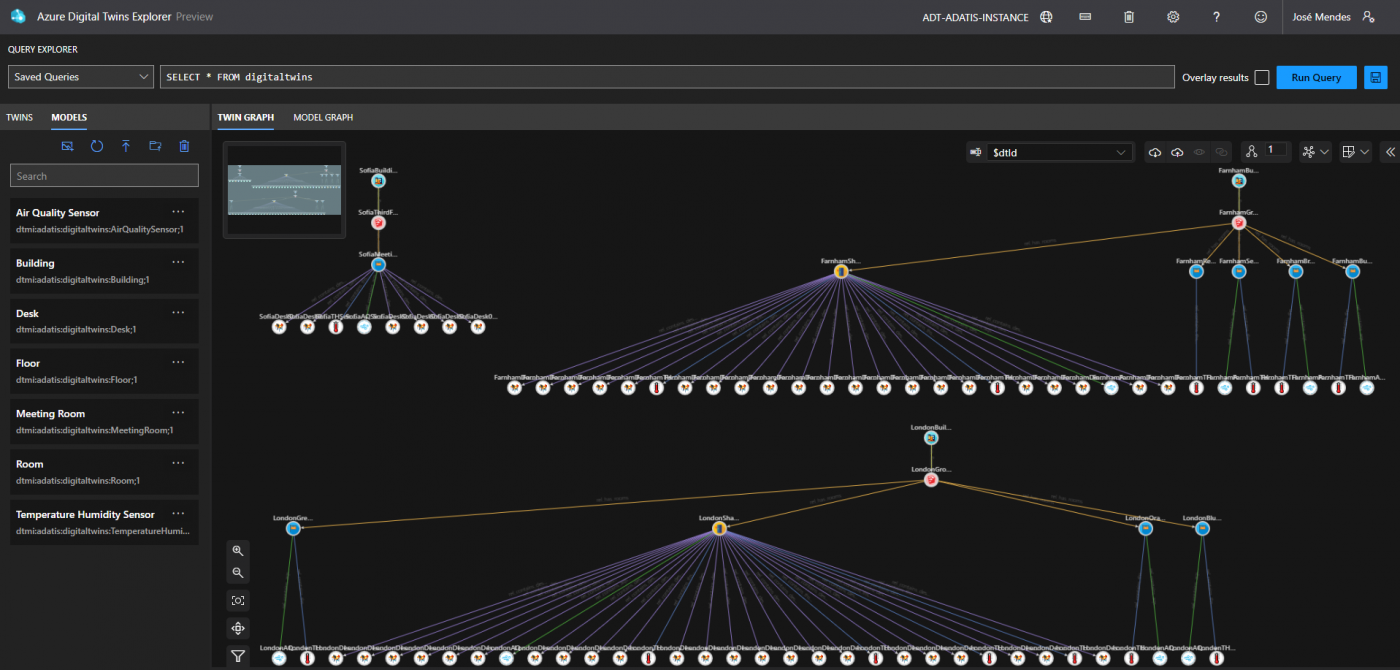
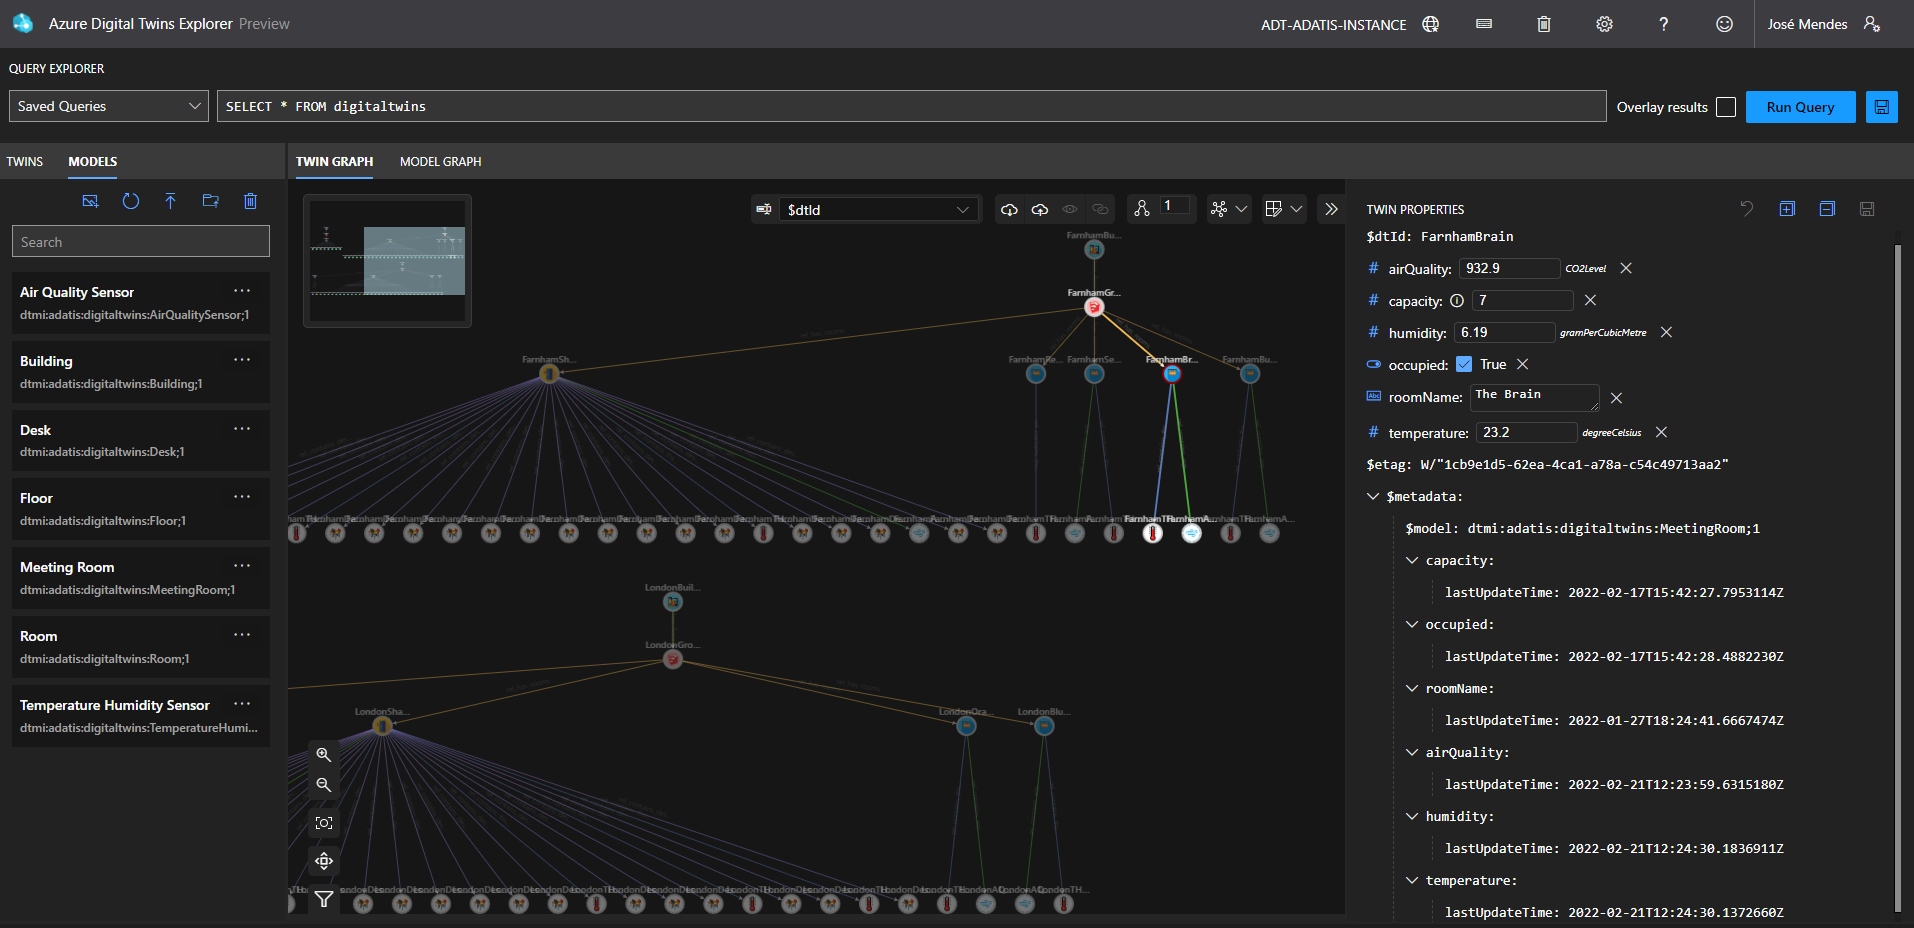
Now that we have a model and an architecture, it’s time to start creating the twins. I won’t go into the detail on how to create them as you can easily find that explanation in the Microsoft documentation.
Using Azure Digital Twins, we created a simple digital representation of our offices in Farnham, London and Sofia. Once you have your models uploaded, it is very simple to create and extend the twins.

Step 5
This is when the actual fun starts, as you start plugging all the different components together. Let’s take a look at the following architecture:
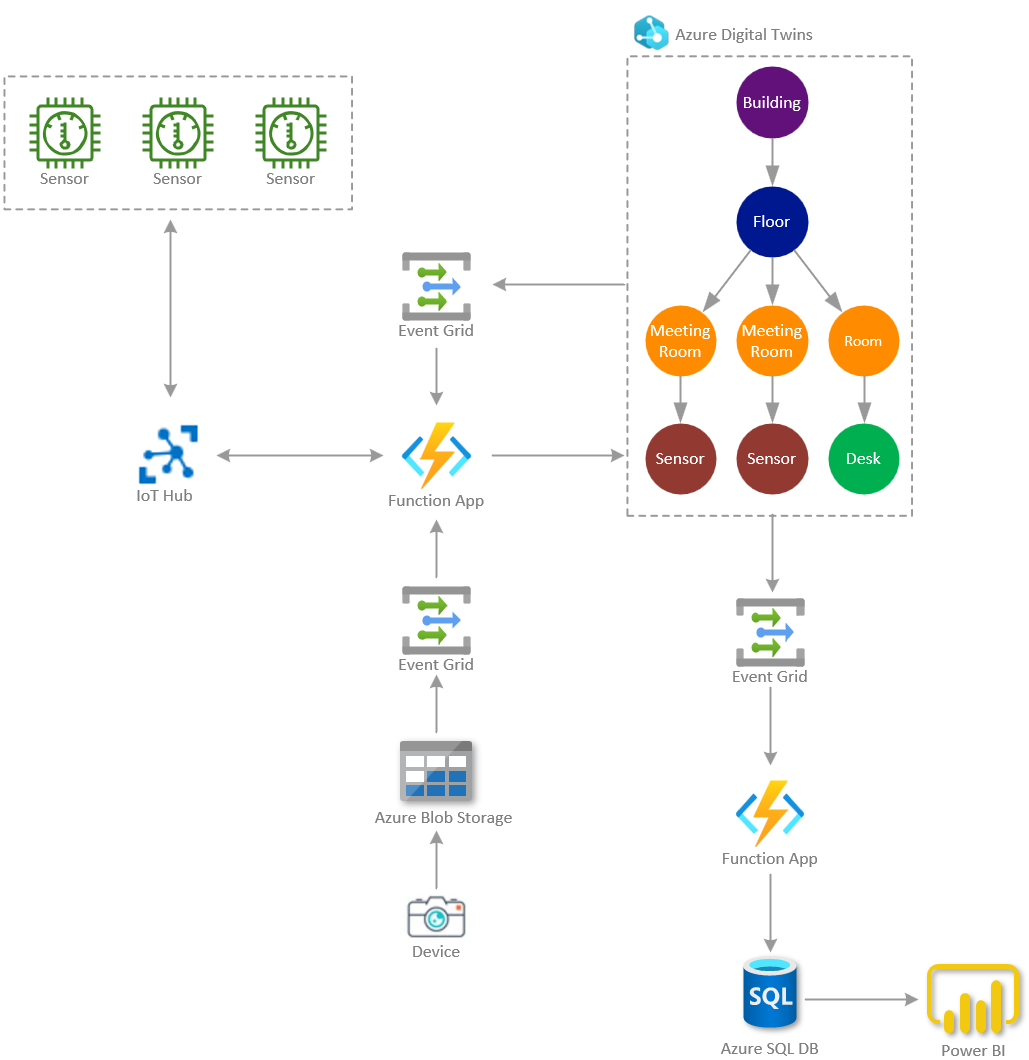
From the left-hand side, we configure the IoT devices that capture the temperature, humidity and air quality and connect them to Azure via the Azure IoT Hub. Using Event Grid and Azure Function Apps, we capture the events and upload the twin properties. Based on a set of routines, we can then communicate back to the IoT device and apply certain actions, such as lowering or increasing the temperature.
Using cameras, we take photos from the rooms and temporarily upload the image to an Azure Blob Storage. Upon upload, using Computer Vision, we capture how many people are in the room and once again upload the twin properties.
The Azure Digital Twin can only capture the most recent data, which is why it is important to persist all the data in an Azure SQL DB to allow further data analytics capabilities that can be explored in Power BI.
Step 6
It’s time to start exploring the collected data. As opposed to what you may find in many articles and offerings, you don’t need to have 3D modelling skills to explore the Digital Twin. If you are a housing association with thousands of properties, building a 3D representation of each one is just not scalable and cost effective. As I will demonstrate, it is possible to find a mid-term by using custom applications or our good old friend, Power BI.
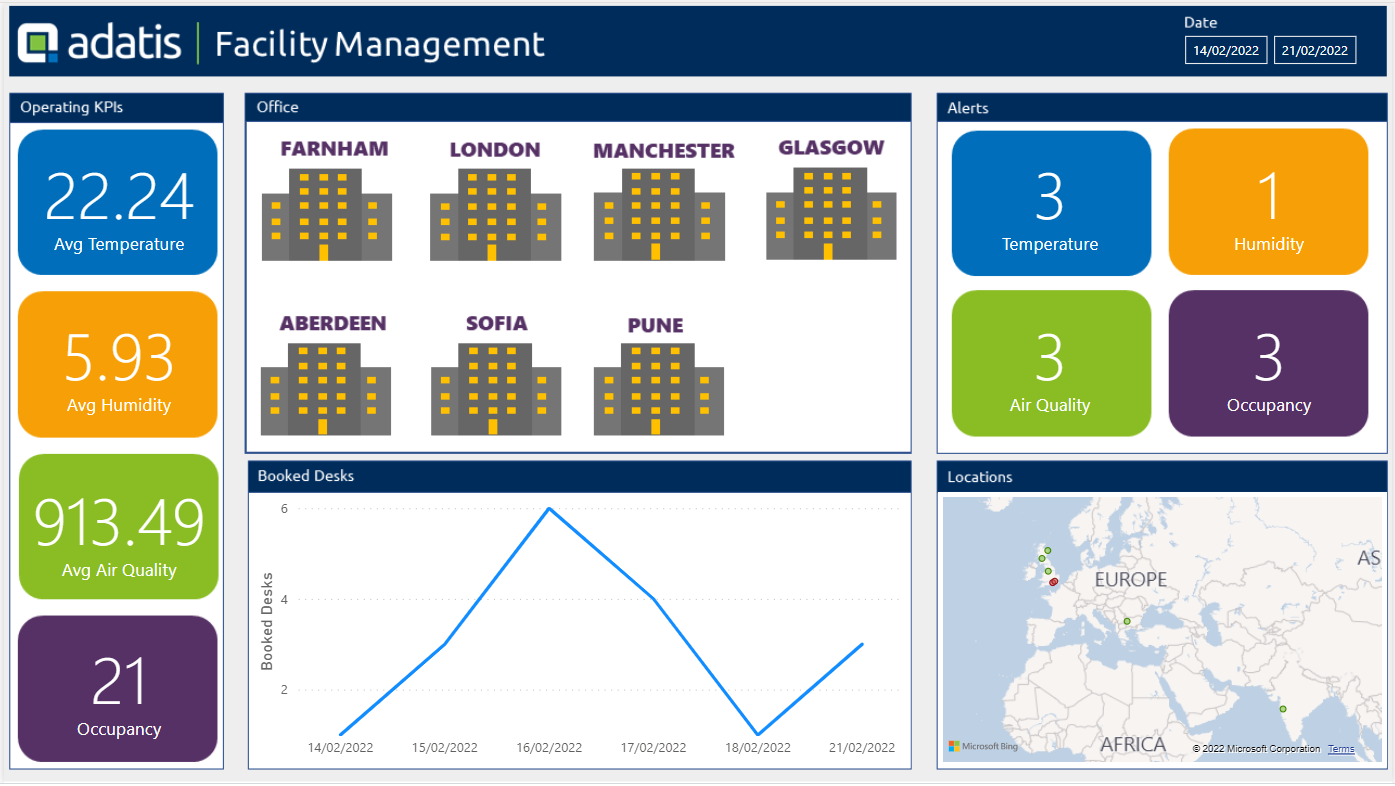
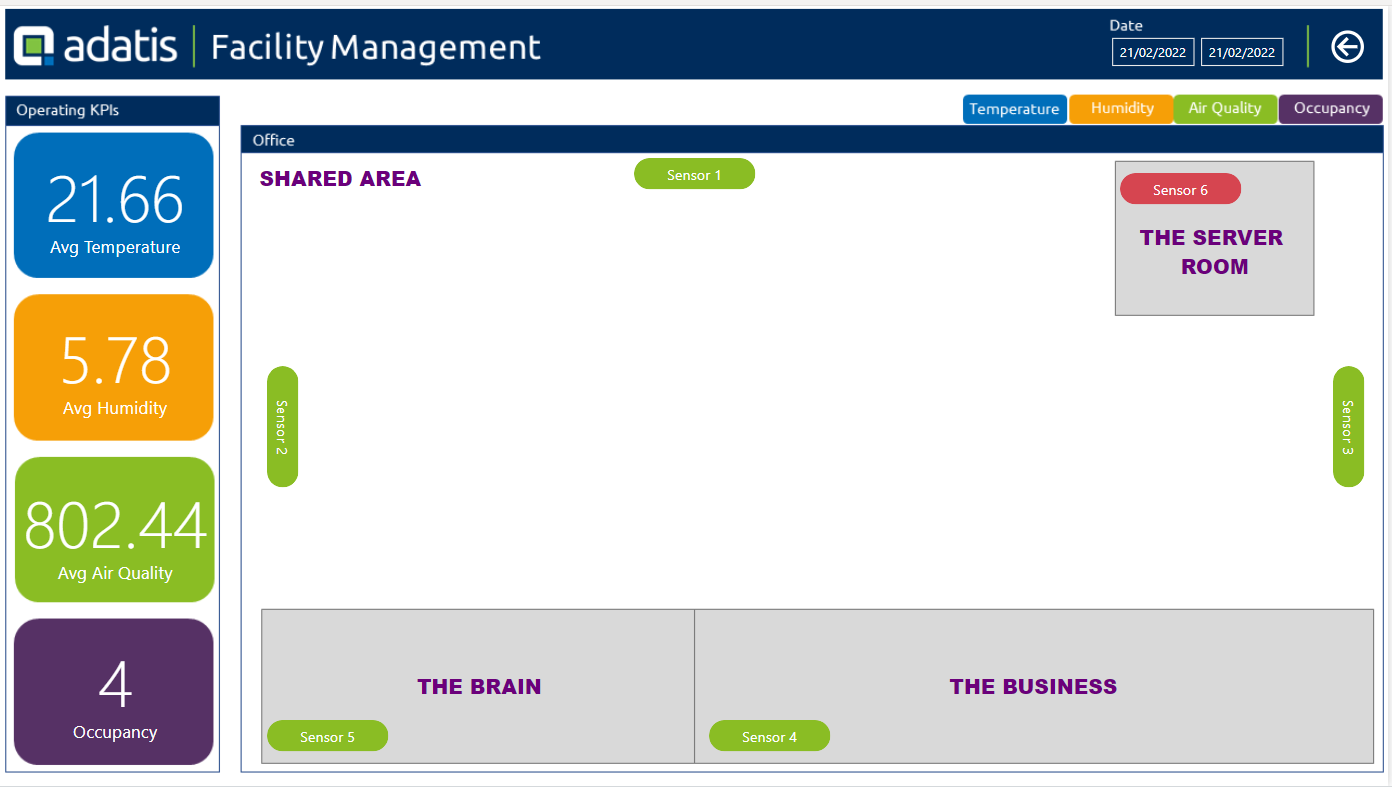
The landing page gives a real-time overview of our main KPIs and help us understand where there are problems that require our attention.
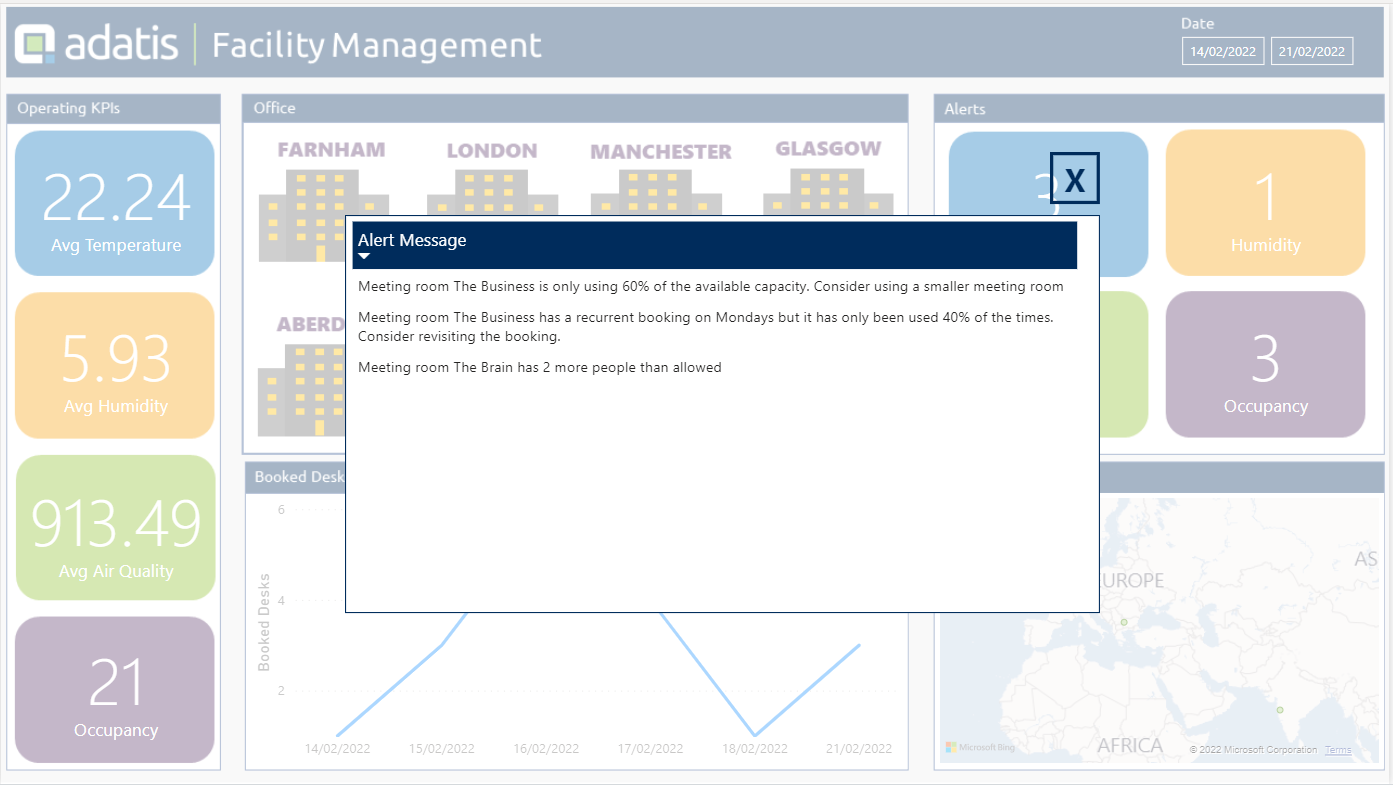
The alerts not only raise immediate problems, like breaching the capacity limits, but also provides recommendations on how to improve the occupancy of our meeting rooms.
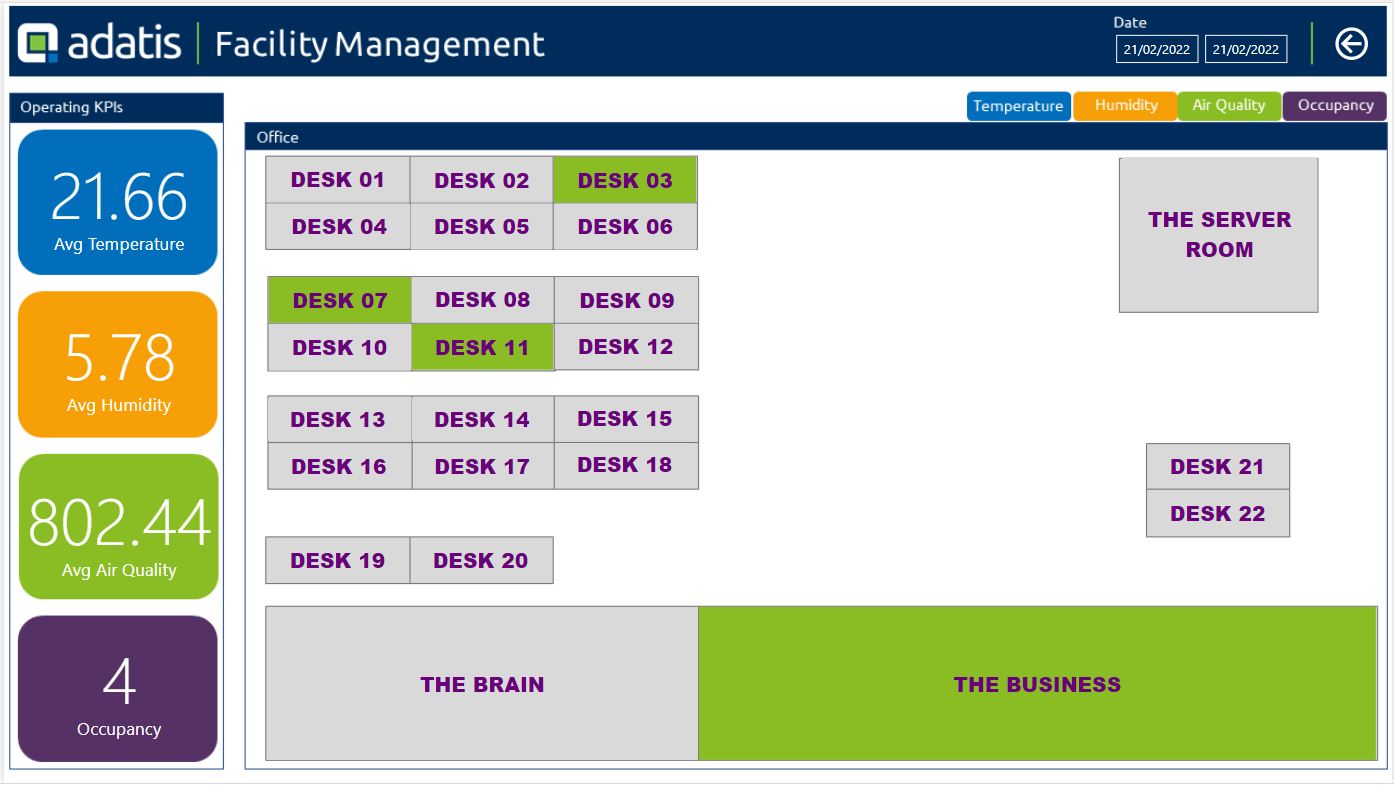
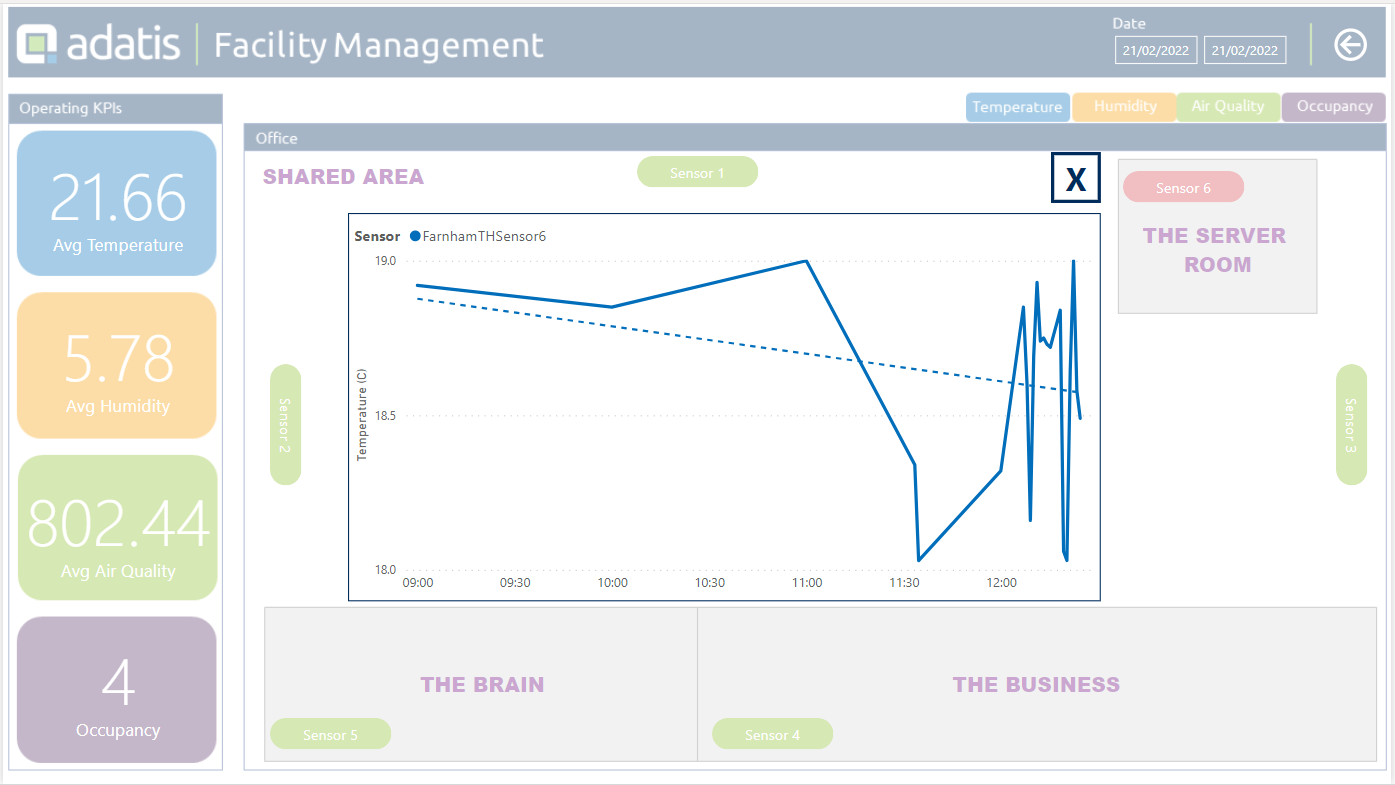
When drilling down by location, we have the capacity to visualize the occupancy of our meeting rooms and desks and find problems, like faulty equipment or temperatures outside the threshold.
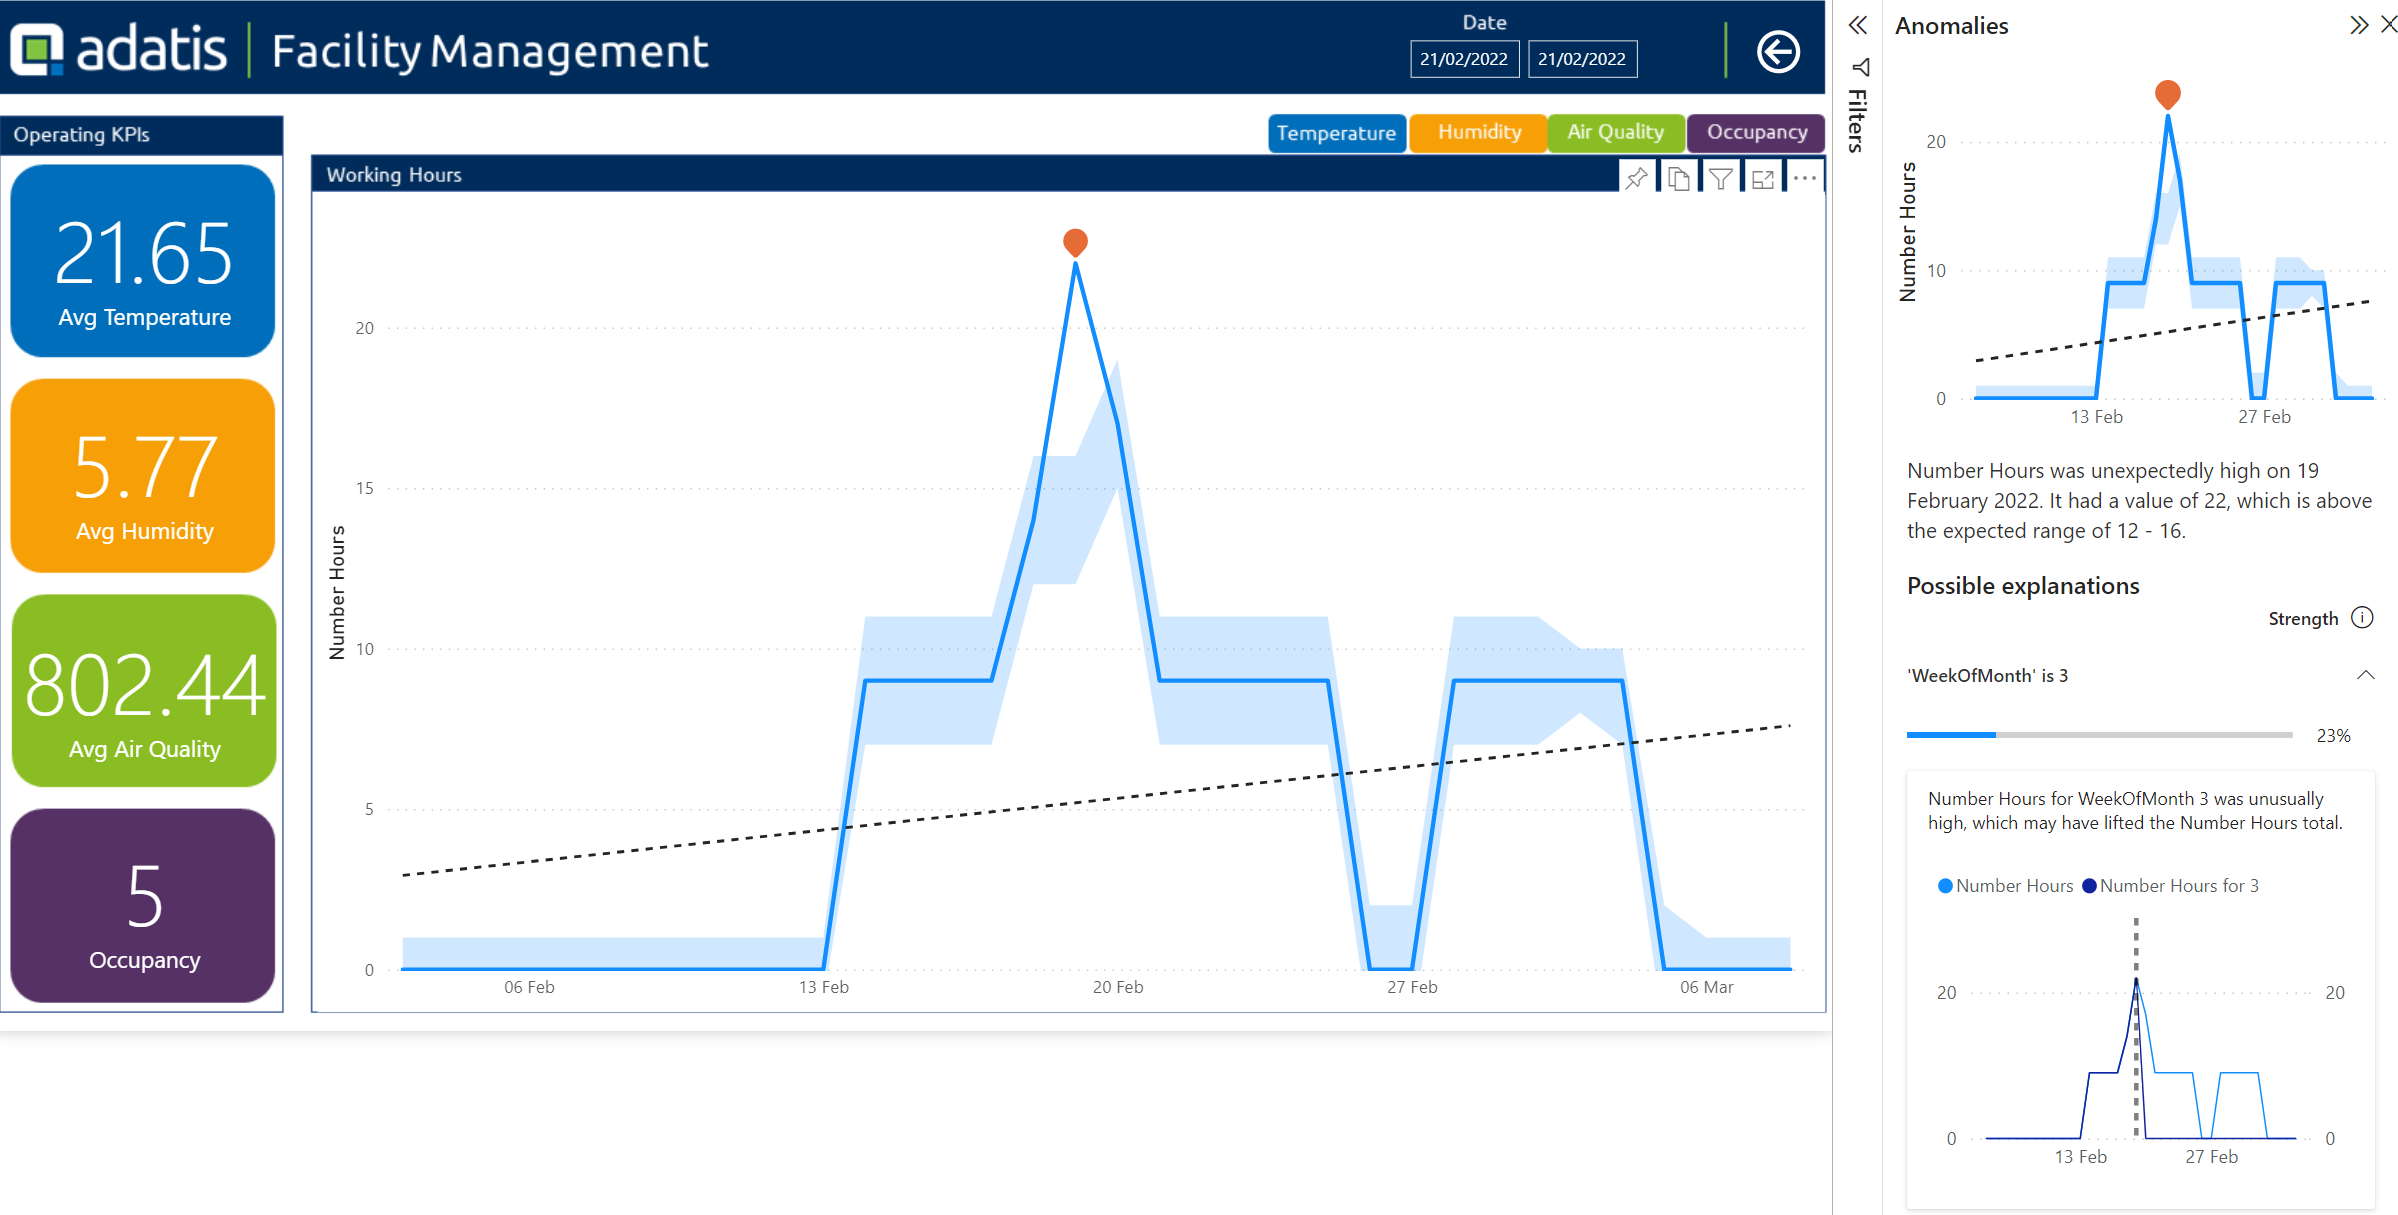
Finally, using the generally available AI features in Power BI, it is possible to investigate anomalies and forecast the occupancy across the different office locations. In this particular case, it is possible to see someone forgot to switch off the HVAC unit during the weekend. Using such information, we can implement new routines to ensure the HVAC units are switched off during certain periods.
As always, if you have any questions or comments, please drop a message and I’ll come back to you as soon as possible. If you would like to know if Digital Twins is the right answer to your business and would like a demo or get a better understand, feel free to get in touch.
Introduction to Data Wrangler in Microsoft Fabric
What is Data Wrangler? A key selling point of Microsoft Fabric is the Data Science
Jul
Autogen Power BI Model in Tabular Editor
In the realm of business intelligence, Power BI has emerged as a powerful tool for
Jul
Microsoft Healthcare Accelerator for Fabric
Microsoft released the Healthcare Data Solutions in Microsoft Fabric in Q1 2024. It was introduced
Jul
Unlock the Power of Colour: Make Your Power BI Reports Pop
Colour is a powerful visual tool that can enhance the appeal and readability of your
Jul
Python vs. PySpark: Navigating Data Analytics in Databricks – Part 2
Part 2: Exploring Advanced Functionalities in Databricks Welcome back to our Databricks journey! In this
May
GPT-4 with Vision vs Custom Vision in Anomaly Detection
Businesses today are generating data at an unprecedented rate. Automated processing of data is essential
May
Exploring DALL·E Capabilities
What is DALL·E? DALL·E is text-to-image generation system developed by OpenAI using deep learning methodologies.
May
Using Copilot Studio to Develop a HR Policy Bot
The next addition to Microsoft’s generative AI and large language model tools is Microsoft Copilot
Apr