Something I have enjoyed doing in the past is making maps, especially ones showing how various things move around London. One thing I did was take some open data on usage of London Santander bikes and passed it through the Google Waypoints API and visualised it using Mapbox:

Which got me thinking, is it possible to do something similar using Power BI? Microsoft introduced the geography data type with SQL Server 2008 and more mapping providers are making versions of their tools available in Power BI, including Esri and Mapbox. From a business perspective, IoT devices are enabling the collection of greater volumes of geographical data for companies to use in their analyses.
Using the GEOjson files I had previously produced for the project above, I set about importing them to a SQL DB instance in Azure as a geography data type. This involved reading the file into a variable and then iterating over the index position of each individual ride.
-- load the geojson file into a SQL variable

DECLARE @geojson VARCHAR(max) = (SELECT *

FROM OPENROWSET (BULK 'C:pathtomyfile', SINGLE_CLOB) as j)

-- use the index position to iterate over each ride

SELECT
    geography::STGeomFromText('LINESTRING(' +STRING_AGG(CAST(long + ' ' + lat as varchar(max)), ',') + ')',4326)
FROM
(
SELECT
*
FROM OPENJSON(@geojson, '$.features[0].geometry.coordinates' )
WITH
(
long varchar(100) '$[0]'
,lat varchar(100) '$[1]'
)
) a
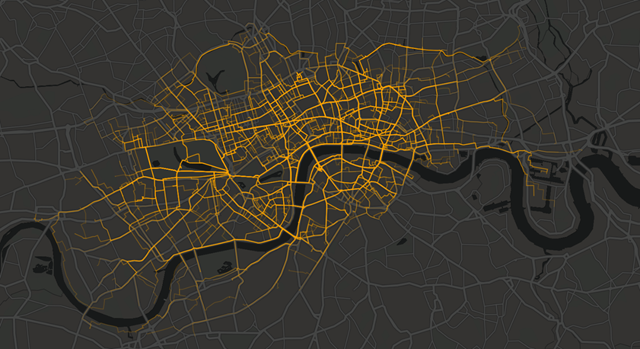
This results in a row per ride and visualises pretty well in SSMS. If you are familiar with the geography of London you can make out the river Thames toward the centre of the image and Regents Park towards the top left:

This could be overlaid on a shape file of London or a map from another provider such as Google Maps or Mapbox.
However, when you try to load the dataset into Power BI, you find that Power BI does not natively support Geography data types. There is an idea you can vote on here to get them supported: https://ideas.powerbi.com/forums/265200-power-bi-ideas/suggestions/12257955-support-sql-server-geometry-geography-data-types-i
After a bit of research it looked like using R within Power BI could be an option. The foundation thinking of this was rather than converting the longitude and latitudes to a geography data type as above I wrote them to a table with an Id to associate each ride and let the ggmap library in R join the dots.
Once you have your data loaded into Power BI, you only need a couple of lines of R code to render the map:
library(ggmap)

qmap("london", zoom=12, maptype="toner-lite") + geom_path(aes(x = long, y = lat, group=LineId), size = .7, data = dataset, colour="#FF69B4", lineend = "round")
An important thing to note is that this R library uses the Google Maps API which could cause some privacy concerns. Also before showing this to users you would want to assign a Google Maps API token in Power BI as without it you are using a generally available connection which means your maps will fail to load a lot of the time.
The resulting map displays the paths – although the sorting of each row gets mixed up somewhere in Power BI for some paths hence the horizontal lines.

And it turns out that the Power BI service does not currently support the use of certain R libraries which use client-server queries over the internet meaning you cannot publish this map.
So as a proof of concept it is possible to display vector paths on a map in Power BI desktop, however you will need to wait until Microsoft supports geography data types in Power BI or allows R libraries which call an external service before taking it any further.
These links provided the basis for this PoC and would be a good starting point if you wanted to take things further:
- https://bertwagner.com/2018/01/16/importing-geojson-earthquake-data-into-sql-server/
- https://docs.microsoft.com/en-us/sql/t-sql/spatial-geography/ogc-methods-on-geography-instances?view=sql-server-2017
Introduction to Data Wrangler in Microsoft Fabric
What is Data Wrangler? A key selling point of Microsoft Fabric is the Data Science
Jul
Autogen Power BI Model in Tabular Editor
In the realm of business intelligence, Power BI has emerged as a powerful tool for
Jul
Microsoft Healthcare Accelerator for Fabric
Microsoft released the Healthcare Data Solutions in Microsoft Fabric in Q1 2024. It was introduced
Jul
Unlock the Power of Colour: Make Your Power BI Reports Pop
Colour is a powerful visual tool that can enhance the appeal and readability of your
Jul
Python vs. PySpark: Navigating Data Analytics in Databricks – Part 2
Part 2: Exploring Advanced Functionalities in Databricks Welcome back to our Databricks journey! In this
May
GPT-4 with Vision vs Custom Vision in Anomaly Detection
Businesses today are generating data at an unprecedented rate. Automated processing of data is essential
May
Exploring DALL·E Capabilities
What is DALL·E? DALL·E is text-to-image generation system developed by OpenAI using deep learning methodologies.
May
Using Copilot Studio to Develop a HR Policy Bot
The next addition to Microsoft’s generative AI and large language model tools is Microsoft Copilot
Apr