Although it’s arguably not the most popular in the Kimball series, The Data Warehouse ETL Toolkit contains a huge amount of vital information that’s focussed on the ETL side of data warehousing. In particular I’ve found the data quality screens design to be useful, so I thought it might be worth exploring if this concept can be applied to Data Quality Services.
What is a Kimball Data Quality Screen?
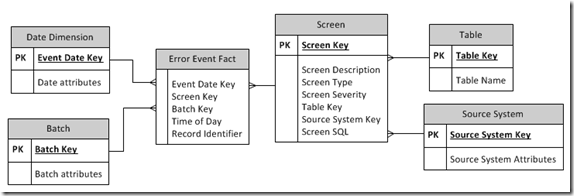
A screen is simply a check that is made against data that comes into the ETL pipeline and is used to measure data quality. Physically, the Kimball screen design is typically implemented as a table called Screen, which contains, as rows, the actual checks to perform against staged data. In addition, the screen table will contain metadata to aid data quality measurement, such as screen severity, category, source system and possibly exception actions.
Each time that a screen yields some results (i.e. data quality issues) then another table, Error Event Fact, is populated with the results. Therefore, by using the data generated by the screening process, The Error Event Fact becomes the place to look for an overall measurement of data quality. The schema for this design from the Kimball book (with a few modifications) is as follows:

The check performed by each screen is typically a snippet of SQL that checks for a particular condition, e.g. Is the customer’s postcode missing, or is the tax amount within permitted ranges?
Can Data Quality Services assist with ETL screening?
DQS is capable of auditing and checking data, as each domain within a knowledge base can have its own domain rules. In order to see how this might work as Kimball screens, I’ve set up a simple knowledge base around purchase orders. Here’s the domain management window from the DQS client:

Within the Delivery Charge domain, I’ve setup a domain rule called ‘Delivery Charge Negative’ in order to ensure that the delivery charge cannot be negative:

I’ve done something similar with the PO Date domain, setting up a rule to state that the PO date must be greater than 01/01/2012 in this case. Data run against the PO knowledge base will now be enforced against these two rules, so these are effectively my two Kimball style screens. To recap, DQS cleaning can be run either from the Data Quality Client or from SSIS.
Populating the Error Event Fact with SSIS
I’m going to be running my DQS domain rules via SSIS, as my end goal is to populate the Error Event Fact. Remember, if any DQ issues occur, I want the Error Event Fact to know about them.
In this scenario, the data from the source system has already been staged to a SQL table, which gives the following results in the SSIS source adaptor preview:

This data is passed to the DQS Cleansing SSIS task, with the data mapped to the DQS Knowledge Base in the following way:

Once the package is run, the data will be passed to DQS, which will run the data against its knowledge base, including running the domain rules. The data that is returned from DQS is as shown below. Note, PO55 row has failed both rules, whereas the other two rows have failed one row each.

Now we know exactly which rows have failed each data quality screen. The only trouble is that the data is in the wrong format for our error event fact. We want a total of 4 rows in the error event fact has PO Id 5 has failed 2 screens, whereas the other two rows have failed 1 screen. Therefore, we carry out a unpivot before inserting into the Error Event Fact. For this blog post my ScreenId is hard coded, but in reality you would have to lookup an appropriate ID for the DQS screen. The full SSIS package is as follows:

Data Quality Reporting
With the Error Event Fact populated, a variety of reports can be produced. In this case I’ve made a very simple Analysis Services cube and made a quick report in Excel 2013, using slicers, sparklines and also the new Timeline feature:

From this report I can see the screen that’s failed the most rows, see a trend of data quality and filter on specific issues.
Summary
With a bit of work, DQS is capable of producing the rows needed for the Kimball Error Event Fact, but how good is it? I see the advantages of using DQS as follows:
- Front end user interface in order to allow data stewards to set up their own rules to screen the data – much better than holding rules in SSIS or manually in a table;
- DQS becomes a one stop shop for all data quality, as, in addition to holding the screens as domain rules, DQS will clean your data for you, according to the valid/invalid domain values that you set up in the knowledge base.
There are a few disadvantages to it also:
- The domain rules are not as flexible as pure SQL or SSIS, meaning that you may not be able to express all the screening rules that you had in mind;
- DQS can’t maintain all the metadata that you need to implement Kimball screening, so you’ll need to supplement it with some SQL tables to hold things like screen severity, screen type etc;
- Even though the performance has been improved in CUI, it’s still not suitable for large amounts of data. Here’s an overview of how long you can expect the SSIS cleansing to take.
So my view is that if you’re already using DQS and data stewards like it using it to manage data quality, and your data volumes are not too big, then implement the classic Kimball screening design using DQS. But there are more cons than pros unfortunately, so if you’ve not already made an investment in DQS, and you have the time to invest in your own Kimball style screening solution, then I think you can come up with something that’s a bit more flexible and scalable.
Introduction to Data Wrangler in Microsoft Fabric
What is Data Wrangler? A key selling point of Microsoft Fabric is the Data Science
Jul
Autogen Power BI Model in Tabular Editor
In the realm of business intelligence, Power BI has emerged as a powerful tool for
Jul
Microsoft Healthcare Accelerator for Fabric
Microsoft released the Healthcare Data Solutions in Microsoft Fabric in Q1 2024. It was introduced
Jul
Unlock the Power of Colour: Make Your Power BI Reports Pop
Colour is a powerful visual tool that can enhance the appeal and readability of your
Jul
Python vs. PySpark: Navigating Data Analytics in Databricks – Part 2
Part 2: Exploring Advanced Functionalities in Databricks Welcome back to our Databricks journey! In this
May
GPT-4 with Vision vs Custom Vision in Anomaly Detection
Businesses today are generating data at an unprecedented rate. Automated processing of data is essential
May
Exploring DALL·E Capabilities
What is DALL·E? DALL·E is text-to-image generation system developed by OpenAI using deep learning methodologies.
May
Using Copilot Studio to Develop a HR Policy Bot
The next addition to Microsoft’s generative AI and large language model tools is Microsoft Copilot
Apr