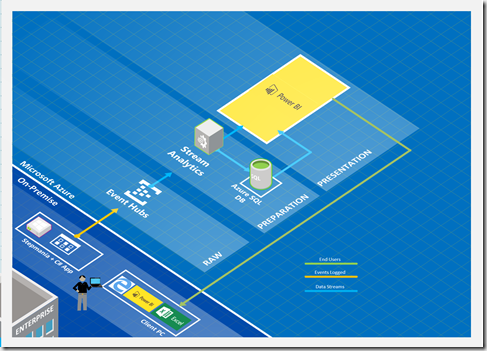
Following the DISCO theme, Adatis decided to present all the SQLBits attendees with a challenge based on the game Dance Dance Revolution. At the end of the game, the players were presented with two Power BI dashboards, one that streamed the data in near real time and the other representing historical data. This blog will detail the different components used in the demo.

(High Level Architecture)
The starting point
The first requirement was to have a game that could run on a laptop and store the output data in a file. Based on the theme of the conference, we chose the game Stepmania 5 (https://www.stepmania.com/download/). After understanding how it worked and what type of details we wanted to capture, we adapted the program so it was possible to save the output in a TXT file every time a key was pressed. Following is an example of how the data was structured.
{“Player”: “0”, “Row”: “768”, “Direction”: “Left”, “NoteType”: “Tap”, “Rating”: “OKAY”, “Health”: “Alive”, “Combo”: “0”, “Score”: “0”, “Artist”: “Katrina feat. Sunseaker”, “Song”: “1 – Walking On Sunshine”, “Difficulty”: “Easy”}
Capturing player details
To complement the game output, we decided to create an MVC application that had two functions, capturing the player details in an Azure SQL DB, and, upload a new Game ID along with the player details to a reference BLOB stored in an Azure Storage Container.
Sending the data to an Event Hub
Since we wanted to stream the data in near real time, we needed an application that could read the data from the output file as soon as it was updated. To achieve this, we built a C# application that was sending the data to an Event Hub. To make sure we didn’t upload duplicate data, we implemented a logic that compared the last row with the previous one. If they were different, the row was uploaded and if not, the program would wait for the next input.
Distributing the data
To distribute the data between the Azure SQL DB and the Power BI dataset, we used two separate Stream Analytics Jobs.
The first job was using the Event Hub and the reference BLOB as inputs and the Azure SQL DB as output, while the second job was using the same inputs but having a Power BI dataset as an output. Due to the dataset limitations, we ensured that all the formatting was applied in the Stream Analytics Query (eg. cast between varchar and bigint, naming conventions, …).
Power BI streaming datasets
In this scenario, the streaming datasets only work properly when created by the Stream Analytics Job. Any of the following actions invalidates the connection between the jobs and the dataset:
· Create the dataset in Power BI
· Change column names
· Change column types
· Disable the option Historic data analysis
When the dataset crashes, the only solution to fix the issue is to delete and re-create it. As a result, all the linked reports and dashboards are deleted.
Representing the data
By the time the demo was built, the connectivity of live datasets to the Power BI Desktop was not available, which means the live streaming dashboard was built using the online interface.
It is important to note that it is impossible to pin an entire page as a dashboard when using live datasets since it won’t refresh as soon as the data is transmitted. Instead, each individual element must be pinned to the dashboard, adding some visual limitations.

The performance of the players could be followed by checking the dashboard streaming the results in near real time. The use of the word near was used several times in the blog because the streaming is limited not only by the internet connection but also by the Power BI concurrency and throughput constraints, meaning the results were not immediately refreshed.
The second report was built using Power BI Desktop and was connected to the Azure SQL DB.

At the end of the game, the players could obtain the following information:
· Who was the winner
· How did they perform during the game
· The number of hits for each rating
· Which direction they were more proficient
Introduction to Data Wrangler in Microsoft Fabric
What is Data Wrangler? A key selling point of Microsoft Fabric is the Data Science
Jul
Autogen Power BI Model in Tabular Editor
In the realm of business intelligence, Power BI has emerged as a powerful tool for
Jul
Microsoft Healthcare Accelerator for Fabric
Microsoft released the Healthcare Data Solutions in Microsoft Fabric in Q1 2024. It was introduced
Jul
Unlock the Power of Colour: Make Your Power BI Reports Pop
Colour is a powerful visual tool that can enhance the appeal and readability of your
Jul
Python vs. PySpark: Navigating Data Analytics in Databricks – Part 2
Part 2: Exploring Advanced Functionalities in Databricks Welcome back to our Databricks journey! In this
May
GPT-4 with Vision vs Custom Vision in Anomaly Detection
Businesses today are generating data at an unprecedented rate. Automated processing of data is essential
May
Exploring DALL·E Capabilities
What is DALL·E? DALL·E is text-to-image generation system developed by OpenAI using deep learning methodologies.
May
Using Copilot Studio to Develop a HR Policy Bot
The next addition to Microsoft’s generative AI and large language model tools is Microsoft Copilot
Apr