An interesting challenge in data warehousing is how to cope with a dimension that is heterogeneous in nature, e.g. a product dimension that only has a handful of attributes for one particular product type, but then may have many more attributes for a different product type. One way to deal with this problem is to create ‘Core and Custom’ dimensions or fact tables, which is a concept I will introduce in this first post, before outlining some of the technical challenges in a later posts.
The ‘Core and Custom’ concept (AKA Supertype and Subtype) is covered by Ralph Kimball in the Data Warehouse Toolkit, where he uses the example of a retail bank selling different types of products, e.g. a mortgage ‘product’ and a current account ‘product’. They both have a balance and an interest amount, which are the facts, but they have a varying number of different dimension attributes. E.g. a Current Account product may have attributes such as ‘Monthly Fee Indicator’ and ‘Debit Card Eligible Indicator’, whereas a Mortgage product may have attributes such as ‘Term’ and ‘Fixed/Adjustable’ to represent Fixed/Variable etc.
I’ve seen this example myself recently where a company sells Commercial Vehicles, Cars, Spare Parts and Bikes. This is the example that I’ll use in order to illustrate the concept a bit further.
Core and Custom Dimensions
If a company wants a global view of all of its product sales, whether they be commercial vehicles, parts, cars or bikes, then an ideal scenario is to have one sales fact table and one product dimension table. Unfortunately due to the diverse nature of the products offered, it could become unmanageable and messy to have a single dimension table that simple has all attributes from all different product lines. For example, a car might have attributes such as Engine Size, Transmission, Airbag Indicator and Fuel Type, whereas a bike might have attributes such as Size, Gender, Speed and Rear Travel – they are clearly very different.
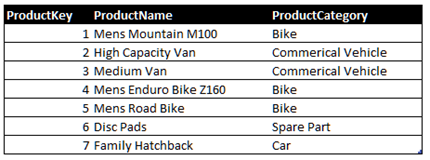
The Core and Custom dimension approach is essentially to have a ‘Core’ dimension table that holds all products, with a column for the surrogate key and then all of the common attributes. The Core dimension table would look like the following:

This is then complemented by the ‘Custom’ dimension tables which are highly specialised dimension tables that are specific to a product line. A given product will be present in both the Core dimension table and one of the Custom dimension tables, with the same surrogate key. This is an important point – a product in the Core table will have the same surrogate key as a product in one of the Custom dimension tables. Therefore in the example below, the highlighted rows in the Core dimension table also appear in the Custom bike product dimension table:


Fact Tables
The idea is that the fact table can be joined interchangeably with either the Core dimension table to get an overview of all products, or to the Custom dimension table to get highly specialised analysis. The Core dimension table would join to a fact table just like any other dimension table:

In contrast, either Custom dimension table could be joined to the fact table according to the type of analysis required. The example below shows how either one of three of the Custom dimension tables could be joined to the fact table:

Note – The above diagram shows the optional join paths for the Custom dimensions to the fact table. From the user’s perspective, a single dimension would always be presented – either all products, in which case the Core dimension would be used along with the whole fact table, or one of the Custom dimensions, in which case the fact table should only contain the products that relate to the Custom dimension, e.g. with a view.
The alternative approach is to have separate Custom fact tables for each business line – this could be necessary if there are specific facts or dimensions that only apply to a particular product line. Therefore an approach with both Custom fact and dimension tables might look as follows:

Summary
My parting thoughts are that whilst I like the Core and Custom approach, you should only use it where appropriate. For example if you have a few product lines and they vary only slightly, then its fine to create a few attributes within a single dimension table that do not apply to all products. On the other hand, if you want to do detailed analysis across highly varied product lines, then Core and Custom dimension and fact tables provide a very flexible method of presenting different information to different groups of users.
Introduction to Data Wrangler in Microsoft Fabric
What is Data Wrangler? A key selling point of Microsoft Fabric is the Data Science
Jul
Autogen Power BI Model in Tabular Editor
In the realm of business intelligence, Power BI has emerged as a powerful tool for
Jul
Microsoft Healthcare Accelerator for Fabric
Microsoft released the Healthcare Data Solutions in Microsoft Fabric in Q1 2024. It was introduced
Jul
Unlock the Power of Colour: Make Your Power BI Reports Pop
Colour is a powerful visual tool that can enhance the appeal and readability of your
Jul
Python vs. PySpark: Navigating Data Analytics in Databricks – Part 2
Part 2: Exploring Advanced Functionalities in Databricks Welcome back to our Databricks journey! In this
May
GPT-4 with Vision vs Custom Vision in Anomaly Detection
Businesses today are generating data at an unprecedented rate. Automated processing of data is essential
May
Exploring DALL·E Capabilities
What is DALL·E? DALL·E is text-to-image generation system developed by OpenAI using deep learning methodologies.
May
Using Copilot Studio to Develop a HR Policy Bot
The next addition to Microsoft’s generative AI and large language model tools is Microsoft Copilot
Apr