There have been a huge number of additions to the Azure platform over recent months, with a few exciting features for those of us in the BI world.
At the second Adatis Hackathon we decided to delve into these features to see what we could create. The plan was ambitious to say the least – three teams would each take a different new feature and attempt to assemble them into a coherent system.
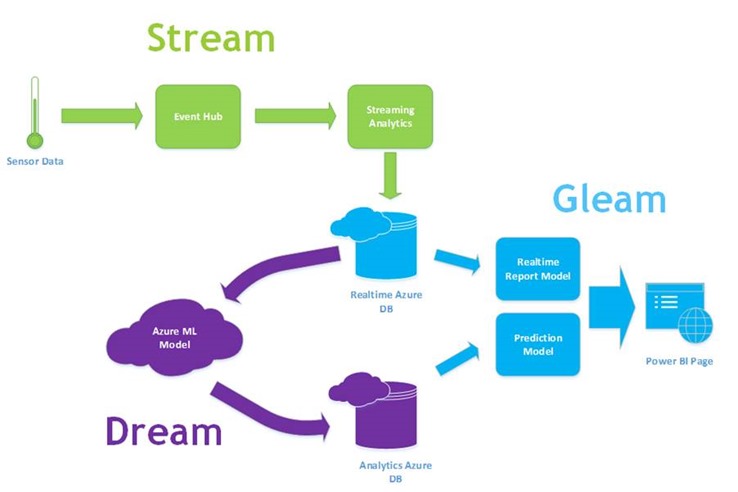
STREAM team would fake a thermostat reading, push it to an event hub and aggregate the data via Stream Analytics.
DREAM team would use this data to predict how old the system has to get before it starts breaking and needs to be replaced. They would achieve this via Azure Machine Learning.
GLEAM team would create live operational and analysis dashboards using PowerBI, specifically via the new Power BI Designer application.
Everyone involved was new to the particular technologies we used, just in case it wasn’t challenging enough.

I captained the STREAM team, with a hope of understanding stream analytics’ role in the future of cloud BI and whether we’ve finally achieved true real-time BI. DREAM and GLEAM will be posting their findings over the coming weeks.
Stream Analytics:
We were up and running incredibly quickly – we spun up an event hub and had it populated with event data using a demo C# script grabbed from a tutorial. We then followed the quickstart guide and had a stream analytics service working away, depositing data.
There was a rather tense moment as we sat waiting for the streaming data to get back to us but, sure enough, we started seeing record counts on the dashboard and records begun to arrive in our Azure DB.
So, having achieved the basic POC very quickly, we went back and added more details to the message stored in the event hub. Just a couple of additional string and numeric attributes that we could use in some interesting aggregations.
This is where our problems began – we had to fiddle around a little, recreating the event hub a few times to be very clear about what was making it through. However Stream Analytics proved nearly impossible to debug. There are operational messages when things clearly aren’t working – you’ll see errors in the operational log when it can’t connect to the database etc, but we got to a point where we saw 1000 input records and 0 output records with no details about why. Was our query incorrect? Were there data mapping problems at the destination? Did we need to rebuild the analytics query to refresh the metadata? We resorted to blind fixes to resolve the issue – each time having to wait 10+ minutes to see if our changes had taken effect.
In the end we ran out of time before fully getting to the bottom of the issue. Our overall impression is that it could be a very powerful service and has a myriad of uses, especially around the implementation of real-time BI. However as a development experience it is truly frustrating, there is too much black box and not enough debugging/error logging functionality.
Obviously we’re still in a preview phase and it’s entirely possible that we simply missed the various debugging options – but I’d certainly be wary of recommending a client down this route until I was much more confident that any issues could be dealt with.
Not to be deterred, I’m determined to get a more advanced streaming example set up over the next few weeks. I’ll be posting my findings when I do…
Introduction to Data Wrangler in Microsoft Fabric
What is Data Wrangler? A key selling point of Microsoft Fabric is the Data Science
Jul
Autogen Power BI Model in Tabular Editor
In the realm of business intelligence, Power BI has emerged as a powerful tool for
Jul
Microsoft Healthcare Accelerator for Fabric
Microsoft released the Healthcare Data Solutions in Microsoft Fabric in Q1 2024. It was introduced
Jul
Unlock the Power of Colour: Make Your Power BI Reports Pop
Colour is a powerful visual tool that can enhance the appeal and readability of your
Jul
Python vs. PySpark: Navigating Data Analytics in Databricks – Part 2
Part 2: Exploring Advanced Functionalities in Databricks Welcome back to our Databricks journey! In this
May
GPT-4 with Vision vs Custom Vision in Anomaly Detection
Businesses today are generating data at an unprecedented rate. Automated processing of data is essential
May
Exploring DALL·E Capabilities
What is DALL·E? DALL·E is text-to-image generation system developed by OpenAI using deep learning methodologies.
May
Using Copilot Studio to Develop a HR Policy Bot
The next addition to Microsoft’s generative AI and large language model tools is Microsoft Copilot
Apr