Introduction
I have been having a bit of hands on with PowerPivot just lately and one of the aspects of PowerPivot that I think is extremely powerful is that it provides users with the ability to mash up their own data in Excel with data from a structured SQL Server database. More specifically allowing users to create and control how granular attributes of a dimension might rollup up into a hierarchy is a valuable thing, for example an organisational structure or an accounts hierarchy. Users do need to be quite good with data modelling and DAX to leverage PowerPivot and time will tell on that one. However, with that in mind I’m going to create a user controlled custom rollup on an accounts dimension using only very basic data modelling and DAX concepts.
Essentially within an accounting solution you might want to avoid storing numbers in the context of positive (+ve) and negative (-ve) since in accounting terms either the business owns it or it doesn’t i.e. it’s either an asset or a liability. Also things come into the business and things go out i.e. they purchase supplies and sell goods and services. None of the accounts themselves are either +ve or –ve since in accounting we deal with either credits or debits. Depending on what aspect of the business you’re evaluating and how you’re presenting the figures an account may be considered as in credit for one context but in debit for another. For example the Closing Balance of Stock is considered a Credit in the P&L but a Debit in the Balance Sheet.
In BI data modelling terms we deal with this by associating the aggregation operator with the reporting dimension hierarchy rather than the number itself thus when the measure is combined with the hierarchy it is aggregated within the context of the hierarchy. More specifically if you’re familiar with SQL Server Analysis Services (SSAS) we do this using a rollup operator that is stored on the accounts dimension.
This blog is a simple PowerPivot design pattern to allow business users to create their own custom rollups on an accounts dimension and trial balance fact table from SQL Server.
Solution
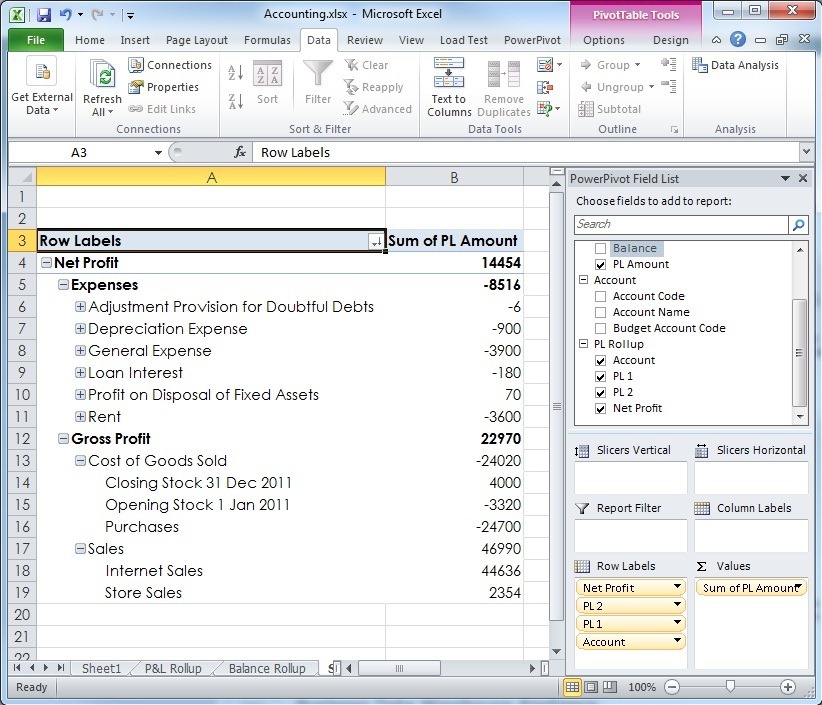
I always like to present the final solution before going into the specifics of the design since knowing the final output tends to make design details a bit easier to digest. So here’s what we’re aiming for:

So here we can see I’ve got a P&L hierarchy that rolls up the accounts through Gross Profit and Expenses and calculates the Profit. The accounts and figures have all been take from a SQL Server database however which accounts and how they have been rolled up into Cost of Goods Sold, Sales, Gross Profit, Expenses and Net Profit has all been created and controlled by the Excel user. The P&L roll up is created from the following table in the Excel file that is linked into the PowerPivot model:

So in this table we can see the accounts mapping to relevant parent P&L members and a rollup operator that indicates how the account should be evaluated. The Rollup operators should look familiar if you’re from a SSAS background like me since the symbols are the same. + is for sum, – is subtract and ~ is to exclude. Notice there are many accounts that are not used here since they are not included in the P&L and as such have no parents defined either. A different rollup application might have the numbers excluded from the rollup but still have them included in the hierarchy.
Implementation
The underlying SQL Database contains an Accounts dimension, Date dimension and a fact table containing account Balances. The simple star schema is as follows:

From the diagram we can see that the Account dimension is simply a list of accounts and there is no hierarchy. FactBalance contains the account trial balances which are all physically positive numbers which can conceptually be either summed or subtracted. I’ve included a very simple Date dimension as usual since it’s always good to see how a solution works with more than 1 dimension in play to test and understand what is going on inside the software without making it too complex.
The next step is to pull these 3 tables into Excel 2010 using the PowerPivot add-in. I won’t go into how this is done in detail since there’s loads on the web about getting started with PowerPivot and I’m assuming if you’re looking to do custom rollup then you’ve already made a start with the basics. This is a pretty good book to get your hands on since it covers the basics and some more advanced topics you can get your teeth into further down the road: MS PowerPivot for Excel 2010 (Marco and Alberto)
Below is the Accounts dimension and Balance fact table that I’ve pulled into PowerPivot and renamed for usability.

The next step is to go to the Balance table tab and relate for Account_Key to the Account_Key in the Account table and Date_Key to the Date_Key in the Date table. If your database had these relationships when you imported the tables then PowerPivot will have created them automatically.
So, now we have our PowerPivot model we’re going to create a table in Excel to rollup the Accounts dimension. Enter the following data into spread sheet in the workbook.

With Cell A1 selected click the Link Table icon on the Excel PowerPivot tab.

This will import the data into the PowerPivot model linked directly to the data in the Excel sheet. Rename the new table we’ve just imported to something useful and relate the Account dimension to it using the Account Code and it should look like as follows:

So now we have all the data nicely imported into PowerPivot and related together we’ll apply the custom rollup. To do this I’m going to use the way that SSAS actually applies the operators under the covers (I believe but am sure someone will correct me if I’m wrong). Essentially + operator multiples the fact data by +1, – multiplies the fact data by –1 and ~ multiplies the fact by 0 or null to effectively yield null. After the operator has been multiplied which adjusts the sign of the data or nulls it out we leave it to PowerPivot to simply sum the result to give the answer. At this point you’re probably right in thinking I could’ve just used +1, –1 and 0 instead of +, – and ~ however I just wanted it to be consistent with what we’re (or I’m) used to in SSAS.
In the Budget table we’re going to create a calculated column called PL Operator that uses the PowerPivot relationships we’ve defined to pull the operator down into the Budget table. The simple DAX formula I’ve used can be seen in the next screen capture:

Once we have the operator we can create another calculated column to create the PL Amount column that applies the operator by multiplying PL Operator with the Balance as shown below.

So we can see the PL Amount column now has the rollup operator applied. The only thing left to do is review what columns you want to make visible in the model and drop a pivot table onto a spread sheet and have a look. We could’ve just used 1 calculated column to achieve what we needed to do, I broke it down into 2 just for presentation purposes. Have a play at modifying the Excel based data rollups and refreshing the data model to see how quick and easy it is to manipulate the rollup.
Conclusion
This is a really simple way for users to consume data from a database and apply a very simple custom rollup. I really like the simplicity of it and the fact as a user I can just edit my rollups in my sheet and refresh the data and adjust how the accounts roll up. Also you might have noticed there are trial balance figures for the accounts in my data that would be needed to create a balance sheet and so we could progress this further by having another roll up table to create a Balance Sheet.
I’m going to have a play around a bit more and see if it’s possible to create more complex rollups and perhaps apply different rollup operators for different columns instead of just at the grain of the account. This is where I suspect things will become somewhat more complicated very quickly! Coming from a SSAS background I find it quite useful to take SSAS modelling concepts and challenge my self and PowerPivot to achieve the same end. PowerPivot modelling is a different way of thinking and whilst it may not do what SSAS does out of the box I’m convinced where there is a will there is a way, or maybe not.
Introduction to Data Wrangler in Microsoft Fabric
What is Data Wrangler? A key selling point of Microsoft Fabric is the Data Science
Jul
Autogen Power BI Model in Tabular Editor
In the realm of business intelligence, Power BI has emerged as a powerful tool for
Jul
Microsoft Healthcare Accelerator for Fabric
Microsoft released the Healthcare Data Solutions in Microsoft Fabric in Q1 2024. It was introduced
Jul
Unlock the Power of Colour: Make Your Power BI Reports Pop
Colour is a powerful visual tool that can enhance the appeal and readability of your
Jul
Python vs. PySpark: Navigating Data Analytics in Databricks – Part 2
Part 2: Exploring Advanced Functionalities in Databricks Welcome back to our Databricks journey! In this
May
GPT-4 with Vision vs Custom Vision in Anomaly Detection
Businesses today are generating data at an unprecedented rate. Automated processing of data is essential
May
Exploring DALL·E Capabilities
What is DALL·E? DALL·E is text-to-image generation system developed by OpenAI using deep learning methodologies.
May
Using Copilot Studio to Develop a HR Policy Bot
The next addition to Microsoft’s generative AI and large language model tools is Microsoft Copilot
Apr