After running a modelling workshop with end users, my next activity on a project is generally to produce a prototype model with some test data, in order to check with users that the planned star schema design will work. My tool of choice for this job tends to be Power Pivot, but I was presented with a slightly different solution when working with a client recently. This got me thinking it would be worth contrasting the two approaches….
Power Pivot
First of all, lets start off with Power Pivot. The goal here is to quickly produce a prototype to verify the star schema design. I tend to just request that a business user brings along an Excel workbook with samples of each dimension and facts pre-extracted in Excel, which can then be loaded into Power Pivot. I find that this saves time, although as an alternative of course Power Pivot could extract directly from SQL Server, Oracle etc if needed.
As an example, we can quickly walk through creating a very simple model to create a star schema:
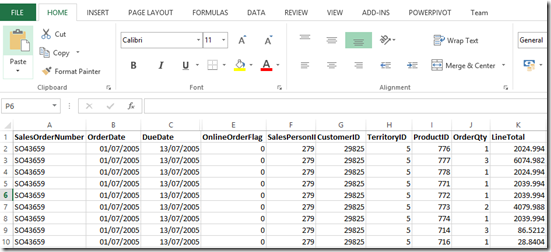
- I’ve copied the data that represents my single fact table and related dimensions into Excel. In this case it’s to model a simple Sales Order Transactions fact, therefore my Excel workbook has dimensions such a Product, Customer, Sales Territory etc, as we well as the data that represents the fact table:
- After completing and closing the workbook, we now create a new workbook and open the Power Pivot window.
- Within the Power Pivot window, the next step is to import the data from the Excel workbook created in step 1. This can be done by choosing From Other Sources->Excel workbook and then browsing to the file.
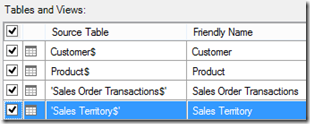
- Power Pivot will now present us with all of the sheets that it finds in the workbook, so we select the sheets that represent the dimensions and facts:
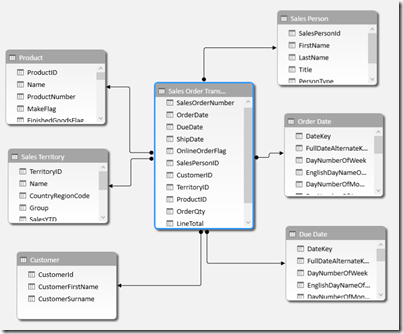
- The next step is to setup relationships between the various tables. Once this is done, we have a simple prototype data model, as shown below:
After a bit of tidying up (e.g. creating some hierarchies and removing unwanted columns), we can now connect to a Pivot Table in Excel that will help verify the star schema:
They key point here is that we have rapidly built a prototype, without the need for any ETL. This means we can quickly cover the design issues with the users, but this time with their actual data, rather than just on a whiteboard.
Analysis Services
The alternative approach that was presented to me recently is to develop the Analysis Services cube/Tabular model before carrying out the ETL. Essentially this means that the users connect to cube, as a production system, unaware that under the hood the ETL is not yet complete.
How is this achieved? Essentially by putting logic in the SQL view layer. Its a well known Analysis Services best practice to bind your SSAS objects (e.g. dimensions, measure groups) to SQL Server views, rather than using objects within the DSV. Rather than each view pulling its data from a complete dimension or fact table, instead each view would pull its data from a staging area or a copy of the source database. The idea being that, over time, the contents of each view would be updated to point to the actual dimensions and facts, once they are built.
Therefore a normal view (in this case for a product dimension) that feeds Analysis Services might look like:
SELECT          ProductKey,
                ProductName,
                ProductCategory,
                ProductSubCategory
FROM            Dim.Product
With the ‘No ETL’ approach, the view looks very different, as any transformation and cleaning will have to be carried out from the view:
SELECT          ROW_NUMBER() OVER(ORDER BY PROD.ProductID) AS ProductKey,
                PROD.Name AS ProductName,
                CAST(ISNULL(SUB.Name, 'Unknown') AS VARCHAR(100)) AS ProductSubCategory,
                CAST(ISNULL(CAT.Name, 'Unknown') AS VARCHAR(100)) AS ProductCategory
FROM            [$(AdventureWorks)].Production.Product PROD
LEFT JOIN       [$(AdventureWorks)].Production.ProductSubcategory SUB ON SUB.ProductSubcategoryID = PROD.ProductSubcategoryID
LEFT JOIN       [$(AdventureWorks)].Production.ProductCategory CAT ON CAT.ProductCategoryID = SUB.ProductCategoryID
This therefore incurs some technical debt, as the cube gets built before the ETL or even the physical dimension table. But the idea is that you can get the users using the cube, on production even, then gradually replace the views with proper ETL and dimension tables once you have some more feedback.
Conclusion
The Power Pivot method is tried and tested for me many times – I find that its very quick to get up and running. The Analysis Services approach is not quite as quick to get up and running, but offers the benefit that the cube can continually evolve in a fairly agile manner. Its early days for me using this approach, but the a disadvantage is that the views can get quite complex, impacting performance depending on the data volumes.
Both methods probably have their place. If I wanted to validate my design, I think I would continue to produce a quick Power Pivot model. On the other hand, if quick delivery to production is a must, and the complexity/data volumes are not an issue, then I would use the view approach.


Introduction to Data Wrangler in Microsoft Fabric
What is Data Wrangler? A key selling point of Microsoft Fabric is the Data Science
Jul
Autogen Power BI Model in Tabular Editor
In the realm of business intelligence, Power BI has emerged as a powerful tool for
Jul
Microsoft Healthcare Accelerator for Fabric
Microsoft released the Healthcare Data Solutions in Microsoft Fabric in Q1 2024. It was introduced
Jul
Unlock the Power of Colour: Make Your Power BI Reports Pop
Colour is a powerful visual tool that can enhance the appeal and readability of your
Jul
Python vs. PySpark: Navigating Data Analytics in Databricks – Part 2
Part 2: Exploring Advanced Functionalities in Databricks Welcome back to our Databricks journey! In this
May
GPT-4 with Vision vs Custom Vision in Anomaly Detection
Businesses today are generating data at an unprecedented rate. Automated processing of data is essential
May
Exploring DALL·E Capabilities
What is DALL·E? DALL·E is text-to-image generation system developed by OpenAI using deep learning methodologies.
May
Using Copilot Studio to Develop a HR Policy Bot
The next addition to Microsoft’s generative AI and large language model tools is Microsoft Copilot
Apr