So I was going to do a post on displaying a reporting services report in a PPSM Dashboard but then realised then that the PPS team had already done that:
And then I was halfway through a post on how a Proclarity view works in PPSM when the PPS Team posted one on just that!
Hey guys – leave some for us!! 😉 Just so you haven’t completely wasted your time reading this, here’s a couple of additional points:
- Multi-select filters don’t work with multi-value parameters in RS. It only passes the first item selected through to RS.
- There is no concept of cascading filters in PPSM v1 – The dev team know this is much requested feature. So far we’ve got around this by using a multi-select tree filter and the promise of a fix in the next version!!
- Your don’t need to define anything particularly in your Proclarity to be able to connect a PPSM filter. Just connect a filter that contains valid members from any dimension in your cube. I know Alyson has mentioned this in her post but quite a neat feature I reckon
- If you have a slicer on the background – this will still display within your PAS view as shown below:

-
Remember to consider RS/Proclarity security and kerberos related implications depending on your PPSM security config and environment (Another post coming here i think!)
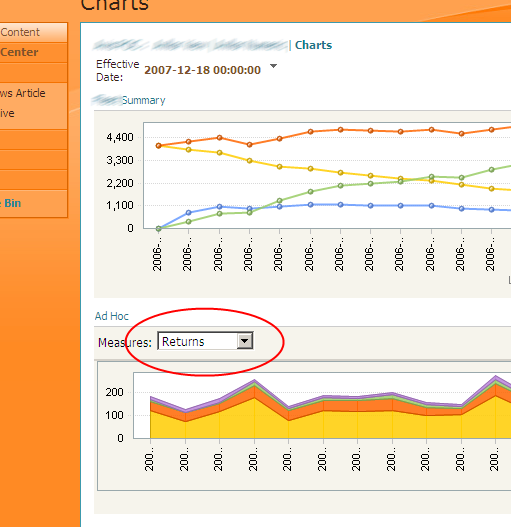
Using these two report types lets you get around a few of the “still to come” features of the built-in analytic chart and grids such as:
- Customise chart colors – (PC/RS)
- Use a secondary Y axis on a chart (PC)
- Use SQL stored procedures as a datasource (RS)
Lastly Nick B has just done a great post on how parameters work with a web page report. This opens up pretty much endless possibilities…

Introduction to Data Wrangler in Microsoft Fabric
What is Data Wrangler? A key selling point of Microsoft Fabric is the Data Science
Jul
Autogen Power BI Model in Tabular Editor
In the realm of business intelligence, Power BI has emerged as a powerful tool for
Jul
Microsoft Healthcare Accelerator for Fabric
Microsoft released the Healthcare Data Solutions in Microsoft Fabric in Q1 2024. It was introduced
Jul
Unlock the Power of Colour: Make Your Power BI Reports Pop
Colour is a powerful visual tool that can enhance the appeal and readability of your
Jul
Python vs. PySpark: Navigating Data Analytics in Databricks – Part 2
Part 2: Exploring Advanced Functionalities in Databricks Welcome back to our Databricks journey! In this
May
GPT-4 with Vision vs Custom Vision in Anomaly Detection
Businesses today are generating data at an unprecedented rate. Automated processing of data is essential
May
Exploring DALL·E Capabilities
What is DALL·E? DALL·E is text-to-image generation system developed by OpenAI using deep learning methodologies.
May
Using Copilot Studio to Develop a HR Policy Bot
The next addition to Microsoft’s generative AI and large language model tools is Microsoft Copilot
Apr