The Bing map engine behind the map visualisation in Power BI is very intuitive allowing users to provide textual data such as City or Country or Postcode to map metrics, instead of just latitude and longitude as most other applications do. However one thing which is not immediately obvious is how to get around the issue of duplicate City/Town names.
In this blog I will explain how to map your metrics when your data source contains duplicate cities/towns.
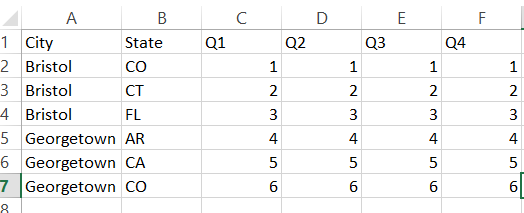
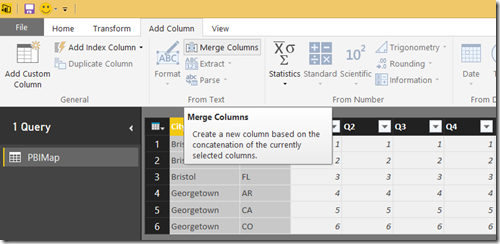
To start with we have a simple data set with quarterly sales for 6 different cities based in 5 different states which is being loaded from a CSV into Power BI. Straight away you can see that we only have 2 distinct city names.
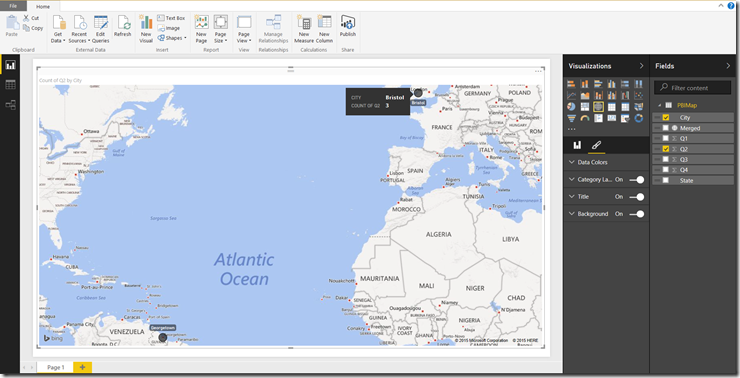
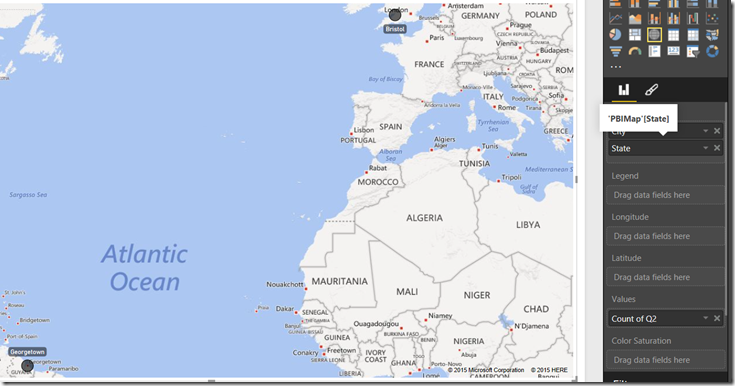
As soon as we try to map the sales data by city, we get an obvious problem all of the Bristol sales are being assigned to Bristol, England, while the Georgetown sales are appearing in Guyana.
Adding state to the Location field does nothing to help the problem as Power BI only reads a single input in the Location field.
So the solution is to create a new column containing both City and State data. To do this you need to complete the following steps:
1. Click “Edit Queries”
2. Select the data source in question.
3. Select the two or more columns which contain the data we want to merge eg: City and State
-If additional geographical data is available such as Country then this can be included in the merged column.
4. Navigate to the “Add Columns” menu and select “Merge Columns”
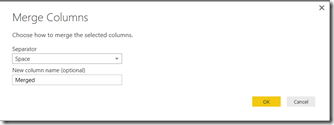
5. Choose the separator value and name the new column
For simplicity I have just called this “Merged” and separated the values using only a space.
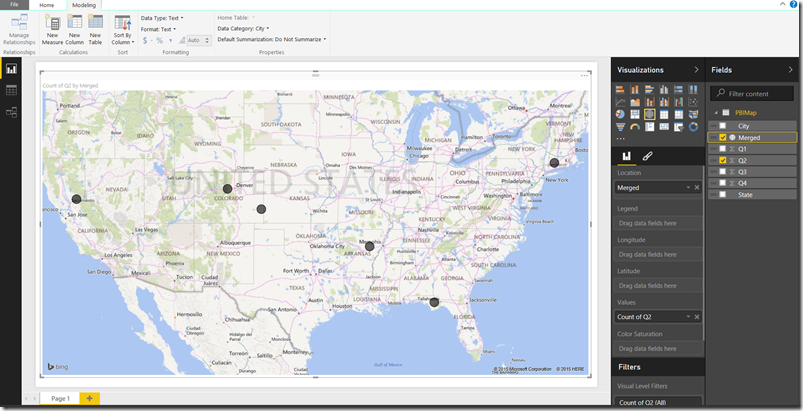
Once the new column has been created it can be dropped into the Location field of the map visualization.
As you can see from the screenshot below I now have 6 data points, showing all three variations of Bristol, and all three variations of Georgetown.
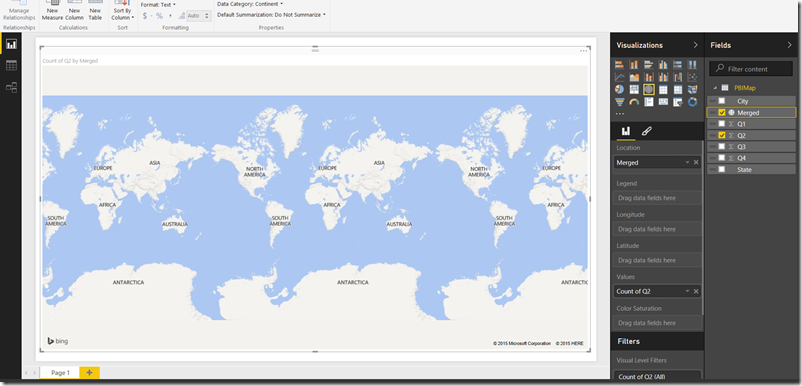
One final tip, is to ensure you have set the Data Category value for the column in question. In this case I have set the Data Category to City to help Bing identify the type of data I believe I am providing it.
The only problem with this, is if you set the Data Category value incorrectly no data will be displayed as shown in this final screenshot where I have changed the Data Category to “Continent”


Introduction to Data Wrangler in Microsoft Fabric
What is Data Wrangler? A key selling point of Microsoft Fabric is the Data Science
Jul
Autogen Power BI Model in Tabular Editor
In the realm of business intelligence, Power BI has emerged as a powerful tool for
Jul
Microsoft Healthcare Accelerator for Fabric
Microsoft released the Healthcare Data Solutions in Microsoft Fabric in Q1 2024. It was introduced
Jul
Unlock the Power of Colour: Make Your Power BI Reports Pop
Colour is a powerful visual tool that can enhance the appeal and readability of your
Jul
Python vs. PySpark: Navigating Data Analytics in Databricks – Part 2
Part 2: Exploring Advanced Functionalities in Databricks Welcome back to our Databricks journey! In this
May
GPT-4 with Vision vs Custom Vision in Anomaly Detection
Businesses today are generating data at an unprecedented rate. Automated processing of data is essential
May
Exploring DALL·E Capabilities
What is DALL·E? DALL·E is text-to-image generation system developed by OpenAI using deep learning methodologies.
May
Using Copilot Studio to Develop a HR Policy Bot
The next addition to Microsoft’s generative AI and large language model tools is Microsoft Copilot
Apr