
Taking the Power BI customers experience to the next level
How to tell a meaningful story with your client’s data?
It’s nearly effortless to overwhelm clients with a lot of data, multiple visuals, colours, and numbers. However, what drives the adoption of business reports is their understandable design for users. A great user interface (UI) is what makes clients start relying on them when making decisions.
The reason for writing this blog series is that I find that a lot of people are developing reports and nearly at the end asking “How to improve the look and feel of my reports?”. Being able to think about user experience upfront can save a lot of rework. Nevertheless, well-structured and easy-to-use reports are highly important for client satisfaction.
If you have your basic data visuals down and your main question is “How to put together the final design?” this post is for you.
Series Index
- Power BI Bookmarks & Selections & Buttons
- Report Page Tooltips
- Benefits of Drill-through and Drill-down
Intro to Power BI Bookmarks, Selections and Buttons
I will showcase how to use bookmarks and selections features of Power BI to improve the interactivity and the overall user experience.
Bookmarks
Bookmarks are a great way to save states of your report so that you can refer to them later. By using them, you can capture the currently configured view of a report page, including filtering and the state of visuals. The real power of bookmarks comes when you create a collection of bookmarks, arrange them in the order you want, and later step through each bookmark to highlight a series of insights, or the story you want to tell with your visuals and reports.
They are available in Power BI Desktop under the View section.
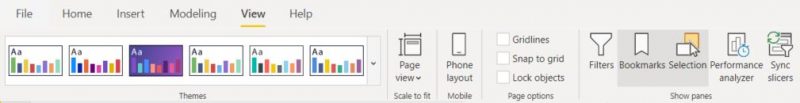
Bookmarks are created for each report page individually and you can set up them in three steps:
- To enable them, go to the View section, and check the bookmarks and selection pane.
- Go to the report page you want to bookmark. Having selected the correct page, click on “Add”.
- We need to make bookmarks for each of the different pages. Go to each report page and set up a new bookmark.
I created a sample report for demo purposes. In my case, I have a report home page and two bookmarks for its different states – with an opened and closed hamburger menu. The main positive of having a home page is that users can navigate between the various pages of the report from one single page.


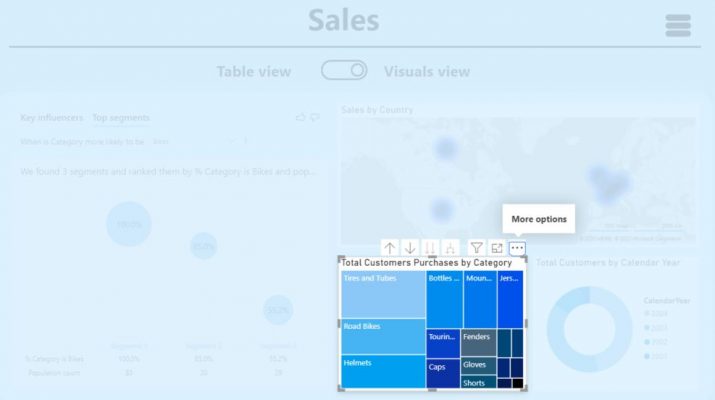
If we click on the three dots next to each bookmark there are several options available – Update, Rename, Delete, Data, Display, Current page, All visuals, Selected visuals.
We will go through each option.
If you created a bookmark and you want to modify it after that (e.g. by including a new visual) you need to click on “Update”. It will update your bookmark with the latest state of all visuals, filers, highlights, and cross-filtering included in your report page.
The “Rename” option does what it says – you can rename your bookmarks by clicking it or with double click on the bookmark itself.
By using “Delete” – the selected bookmark gets deleted.
Data, Display, and Current page are the key options of each bookmark.
The Data option allows you to control what each bookmark is saving at any given time. In this case, I just want to use the bookmarks for navigation. I am going to open that bookmark and turn off the data related option. This is a key part when you have selected filters on your report page – since you don’t want your slicer selections to change after you click a button to navigate to another bookmark. The turned off Data option allows you to make sure that when you move to the next page you are not changing your filter statement – you are just changing the report page. If it is selected at the time of bookmarking, the bookmark will save the currently available status of a report page (its cross, highlighting, drill-downs and sorting).
The next option is Display. Display concerns spotlighting and selection pin. You need it if you would like to spotlight some visuals or hide others. It dims everything else that is included in the display.
The other available option in this group is the “Current page”. Current page allows us to save the current state of the page and if checked you can use the bookmark from another page as well. If “Current page” page is ticked, we can assign the bookmark an action, so that the user can jump over to the selected page. Deactivating this property disables the overall bookmark feature.
The last section in the Bookmarks drop-down menu introduces the choice between “All Visuals” or “Selected Visuals”. We can select only one option at a time for each bookmark.
If we select “All Visuals”, the bookmark will apply to all visuals on the report page.
On the other hand, if we check “Selected Visuals”, the bookmark will work only on selected visual objects, the other visuals won’t be interactive.
Selection pane
The Selection pane has three main purposes.
- It is useful together with the Bookmarks feature. For every bookmark in a bookmark pane, Power BI provides one selection pane. Sometimes, when we perform Bookmarks slideshow to the client with Power BI Desktop, we can hide unnecessary visuals within a click to focus a specific visual.
- It is incredibly useful that it lists everything you have in your report in the Z-order that the things are. If you select one object on from the selection pane you can see where it is on the report. The visuals at the top of the pane are higher up in the Z-order.
- Imagine you developed 5 visuals in a single page of the report and while publishing this report, you only want to show 2 visuals. When you want to hide the other three visuals, the selection pane feature comes handy.
Buttons
The interactivity of my demo report is mainly based on the buttons feature, especially the most powerful among them – the blank button.
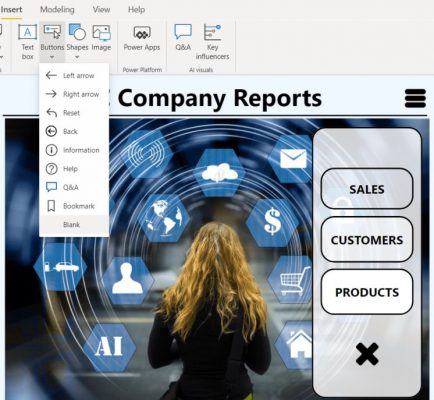
We have various controls available to us for buttons – you can add Button text, built-in icons, also to control the outline/ fill, the “On hover” and “On press” state for the button. Designing your buttons with different states creates the feeling that this report is not something static but rather highly interactive. Once you have designed how your buttons look, it is really easy to set up that navigation effect as well. What these buttons are doing is referencing different bookmarks. The navigation behaviour is set up from the Action card of each button – here you set up what bookmark any button is going to go to when it is clicked on.
In my demo report, the Sales button leads to a Sales report page which I bookmarked as well.

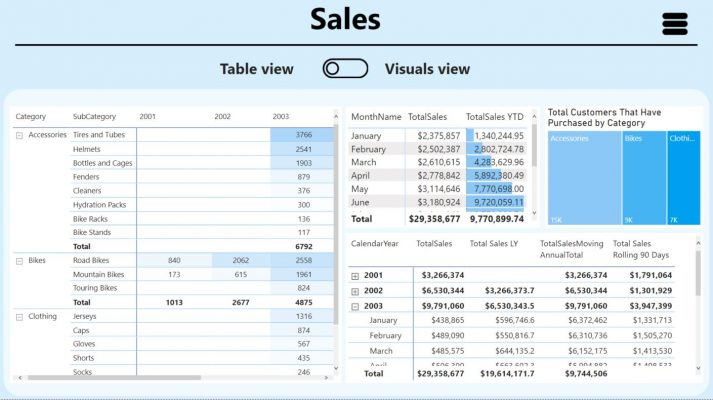
Another useful case of buttons in practice is when you want to switch between different views on one page. If you have too many visuals for one topic on one report page, it makes sense to have them all together in reasonable size and format instead of switching between pages. In my demo, I have a sales information page in two states – one with chart visuals and one with table visuals. The user can easily switch between both views while staying on the same report page. To achieve this effect, you need to insert two .png images and overlay them on each other. In each bookmarked page of my Sales report, only one of the images is set to visible in the Selection pane. I assign the other bookmark as an Action of the image.

After assigning action on the image I can switch to the table visuals bookmark of my Sales report page.
Summary
So far we have discussed some available use cases of bookmarks, selections, and buttons. You can utilise them for creating attractive visuals. You can add different layers one page and create interactive reports. As demonstrated in the blog post, the additional layer will appear as a pop-up window or a dialog box after you click on a button and will show your story-line. This creates a website-like user experience.
Hope you enjoyed my post. If this blog was useful, and you feel you would benefit from further communication with me and Adatis, please reach out to us.
Sources: https://docs.microsoft.com/en-us/power-bi/desktop-bookmarks
Next Time
Coming up next: Page Report Tooltips
Introduction to Data Wrangler in Microsoft Fabric
What is Data Wrangler? A key selling point of Microsoft Fabric is the Data Science
Jul
Autogen Power BI Model in Tabular Editor
In the realm of business intelligence, Power BI has emerged as a powerful tool for
Jul
Microsoft Healthcare Accelerator for Fabric
Microsoft released the Healthcare Data Solutions in Microsoft Fabric in Q1 2024. It was introduced
Jul
Unlock the Power of Colour: Make Your Power BI Reports Pop
Colour is a powerful visual tool that can enhance the appeal and readability of your
Jul
Python vs. PySpark: Navigating Data Analytics in Databricks – Part 2
Part 2: Exploring Advanced Functionalities in Databricks Welcome back to our Databricks journey! In this
May
GPT-4 with Vision vs Custom Vision in Anomaly Detection
Businesses today are generating data at an unprecedented rate. Automated processing of data is essential
May
Exploring DALL·E Capabilities
What is DALL·E? DALL·E is text-to-image generation system developed by OpenAI using deep learning methodologies.
May
Using Copilot Studio to Develop a HR Policy Bot
The next addition to Microsoft’s generative AI and large language model tools is Microsoft Copilot
Apr