On a recent project I was tasked with importing data into Power BI from a Hive table. For those of you who are new to Azure or Big Data, Hive is a data warehousing infrastructure for Hadoop which sits in the HDInsight stack on Azure. The primary purpose of Hive is to provide data summarisation, query and analysis for big data sets. In this blog I’m going to take you through the steps and note any Gotchas so that you can connect to Hive using Power BI.
Connecting to Hive
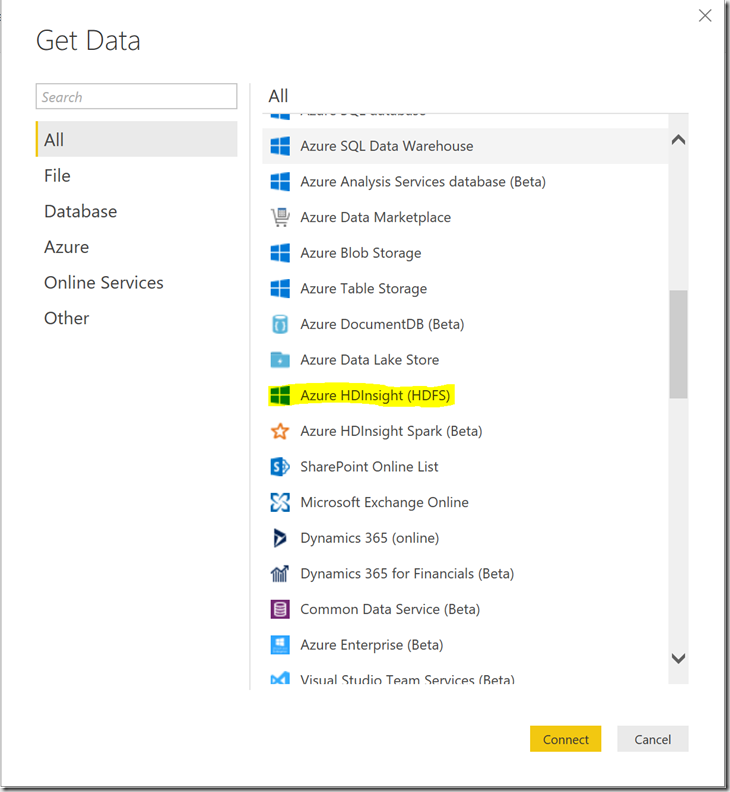
As Hive is part of the Azure HDInsight stack it would be tempting to select the HDInsight or Hadoop connector when you’re getting data. However, note HDFS in brackets beside the Azure HDInsight and Hadoop File options as this means that you’ll be connecting to the underlying data store, which can be Azure Data Lake Store or Azure Blob Storage – both of which use HDFS architectures.

But this doesn’t help when you want to access a Hive table. In order to access a Hive table you will first of all need to install the Hive ODBC driver from Microsoft. Once you’ve downloaded and installed the driver you’ll be able to make your connection to Hive using the ODBC connector in PowerBI.

You will need to input a connection string to connect even though it says optional. The format of the connection string is as follows:
Driver={Microsoft Hive ODBC Driver};Host=hdinsightclustername.azurehdinsight.net;Port=443;Schema=default; RowsFetchedPerBlock=10000; HiveServerType=2; AuthMech=6; DefaultStringColumnLength=200;
One the next screen you’ll be asked to enter a username and password. The credentials used here are not what you use to access Azure but the credentials you created when you set up the HDInsight cluster and use to login to the cluster.
Click connect and you’ll be able to pull through the tables you need into Power BI. Or, if you want to be selective in what is returned, you can write a HiveQL query in the ODBC dialog. It’s also worth noting that at the moment it’s only possible to do an import of Hive Data in Power BI and not perform Direct Query, so if your data set is huge you’ll want to summarise the data or be really selective in what is returned first.
Introduction to Data Wrangler in Microsoft Fabric
What is Data Wrangler? A key selling point of Microsoft Fabric is the Data Science
Jul
Autogen Power BI Model in Tabular Editor
In the realm of business intelligence, Power BI has emerged as a powerful tool for
Jul
Microsoft Healthcare Accelerator for Fabric
Microsoft released the Healthcare Data Solutions in Microsoft Fabric in Q1 2024. It was introduced
Jul
Unlock the Power of Colour: Make Your Power BI Reports Pop
Colour is a powerful visual tool that can enhance the appeal and readability of your
Jul
Python vs. PySpark: Navigating Data Analytics in Databricks – Part 2
Part 2: Exploring Advanced Functionalities in Databricks Welcome back to our Databricks journey! In this
May
GPT-4 with Vision vs Custom Vision in Anomaly Detection
Businesses today are generating data at an unprecedented rate. Automated processing of data is essential
May
Exploring DALL·E Capabilities
What is DALL·E? DALL·E is text-to-image generation system developed by OpenAI using deep learning methodologies.
May
Using Copilot Studio to Develop a HR Policy Bot
The next addition to Microsoft’s generative AI and large language model tools is Microsoft Copilot
Apr