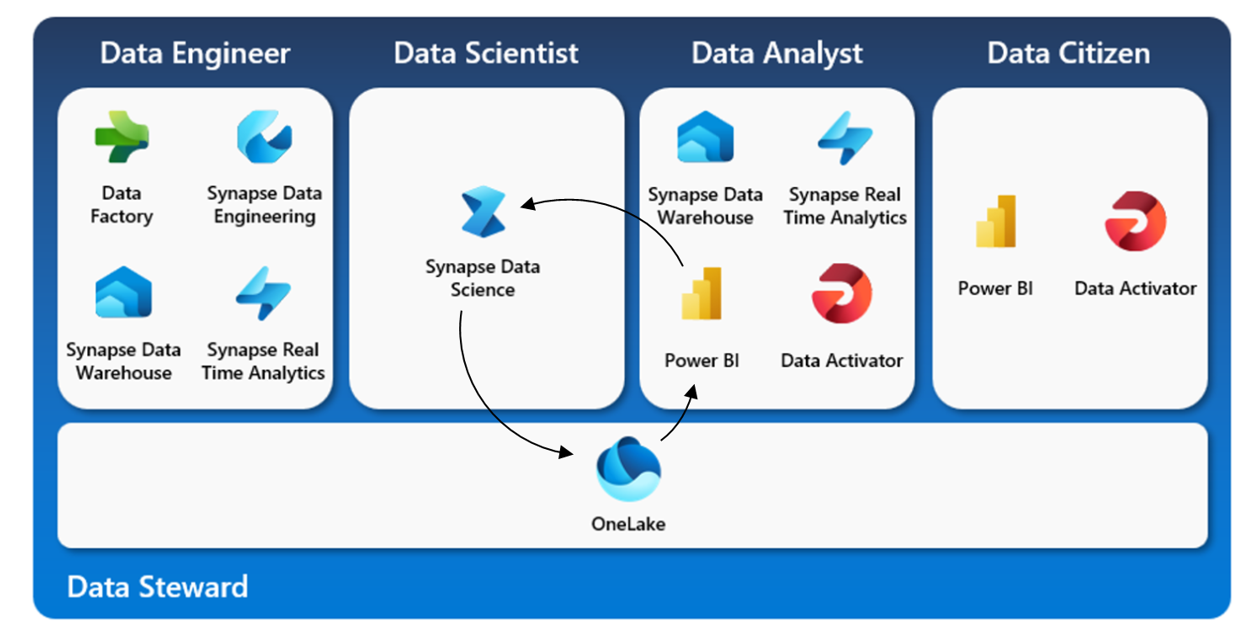
Having previously worked in the water & energy industries, I recently created a utilities PowerBI report for Adatis to use for marketing and sales purposes and thought it would be a good dataset to test the functionality of the recently introduced Semantic Link within Microsoft Fabric.
This feature allows data professionals to access the PowerBI Semantic Layer using Python, R or Spark in a notebook environment to utilise already established relationships, measures and calculated columns. Reports can then be enriched with data science solutions that can be output to OneLake and ingested back into Power BI, maintaining consistency and efficiency within a project.
In this blog I will get us up and running with Semantic Link and showcase some of its features using my utilities dataset.
Process Overview
A premium Fabric workspace with admin permissions is required to use Semantic Link. Once this is established, we can set up a data science notebook in the same workspace as our dataset and install/import the required modules as shown below:

Once these are installed, we can start to perform some analysis on our PowerBI dataset. I have listed the datasets available in my workspace and the corresponding tables for visibility:
Semantic link then provides some great tools for understanding our Semantic Model. Below we visualise the existing relationships in the dataset:
For an even easier approach, we can write in DAX using %%dax cell magic. In the below example, we write DAX to query a Dynamic Management View (DMV) which can be output as a variable to be used in further work if required. This shows all our active relationships between tables and the objects they are referenced on.
The idea with Semantics is not to take the data from PowerBI and rebuild a testing environment for data science solutions, as this may cause discrepancies in business logic and be difficult to integrate into reports. Below is an example of how we can use the measures in PowerBI to write a forecasting model directly on this dataset:
From here we can build a training set, based on the measure for total cost. First we retrieve and display the required data:
This can also be done in DAX if required:
We can then build the training dataset and the model. Once tested, this can be saved to OneLake and used directly in our PowerBI report.
Final Thoughts
Semantics has many great features, a lot of which I haven’t mentioned here. It is available for Spark users by configuring the spark native connector as well as data augmentation using the add_measures function in SemPy to resolve and define columns and filter results by existing rows. Both of these can be found in the Microsoft documentation here.
I hope this has been a useful introduction. Thanks for reading!


Introduction to Data Wrangler in Microsoft Fabric
What is Data Wrangler? A key selling point of Microsoft Fabric is the Data Science
Jul
Autogen Power BI Model in Tabular Editor
In the realm of business intelligence, Power BI has emerged as a powerful tool for
Jul
Microsoft Healthcare Accelerator for Fabric
Microsoft released the Healthcare Data Solutions in Microsoft Fabric in Q1 2024. It was introduced
Jul
Unlock the Power of Colour: Make Your Power BI Reports Pop
Colour is a powerful visual tool that can enhance the appeal and readability of your
Jul
Python vs. PySpark: Navigating Data Analytics in Databricks – Part 2
Part 2: Exploring Advanced Functionalities in Databricks Welcome back to our Databricks journey! In this
May
GPT-4 with Vision vs Custom Vision in Anomaly Detection
Businesses today are generating data at an unprecedented rate. Automated processing of data is essential
May
Exploring DALL·E Capabilities
What is DALL·E? DALL·E is text-to-image generation system developed by OpenAI using deep learning methodologies.
May
Using Copilot Studio to Develop a HR Policy Bot
The next addition to Microsoft’s generative AI and large language model tools is Microsoft Copilot
Apr