If you really want to understand the behaviour of your DAX and be able to write more complex DAX, you need to understand Evaluation Context. The two really do go hand in hand. Many times I have had multiple people ask me to explain what Evaluation Context is which is why this blog post was put together.
To get the most out of this read and be sure the below is
for you, I have constructed a list of questions that you should be able to answer
after reading this blog post:
- What is Evaluation Context?
- What is the difference between Filter Context and Row Context?
- What elements are considered in the Filter Context?
- What is Initial Filter Context (IFC) and what difference does it have with Filter Context?
- How do we read the Initial Filter Context?
- Does Evaluation Context apply before the DAX formula Evaluates?
- Are Grand Total/Sub Totals treated differently with Initial Filter Context?
- What is Context Transition?
- How is Context Transition applied?
What is Evaluation Context?
Evaluation Context is: The environment in which a DAX formula is evaluated in. So, when we write a DAX formula it gets evaluated within an environment. The DAX formula evaluated will be directly dependant on the Evaluation Context. This means the result returned can be different depending on the context, even if the DAX formula used is the same.
Same DAX Formula, different result… huh?
If this is your first read on Evaluation Context, you may be wondering why it is possible to get different results when using the same DAX formula. Let’s make sure we make this clear before moving on. Take a look at the below measure:
Total Sales = SUM(Sales[ExtendedAmount])
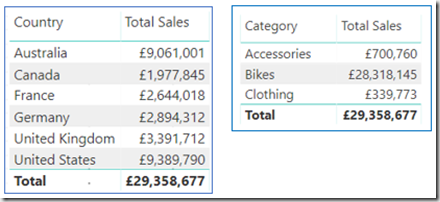
When reading this we interpret it as: “Show me the Total Sales Amount”. But when we add this measure in either of the below matrix’s we get a breakdown by Country and by Category.
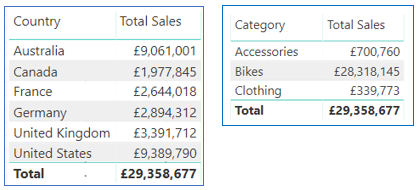
How is this possible? We never specified in the DAX formula anything in relation to Country or Category, right? All we asked for was the “Total Sales Amount”. So, how do we get different values on each row?
It is important to understand why this is happening in order to really understand DAX. The reason this is occurring is due to the:
Evaluation Context:
The environment in which a DAX formula is evaluated
What types of Evaluation Context exist?
We have two types of Evaluation Context:
- Filter Context
- Row Context
Filter Context
Filter Context refers to the filtering that is applied to the tables within the data model. If the tables are joined, the filters propagate from the “one” side of the relationship to the “many” side of the relationship. The Filter Context is applied by:
- Rows in a Visual
- Columns in a Visual
- Slicers in a Report
- Filters in a Report
- Other on-screen visuals acting as filters in a Report
- CALCULATE Function
The DAX formula evaluated within the Filter Context, is only evaluated once all filters have been applied to the Data Model. The deeper you go into Power BI, the more you will hear the term Filter Context. An additional term to be aware of is Initial Filter Context (IFC). This is the same as Filter Context with the only difference being it does not apply the CALCULATE function.
Filter Context in Action
Okay, so we “know” what Filter Context is from what we have read so far! But I believe we can do better and the best way to do better is by looking at Filter Context in action. Below you will find four cases of Filter Context being applied, which once understood will be sure to boost your confidence in understanding this type of Evaluation Context.
One thing worth noting, for each case below we will identify the Initial Filter Context meaning not considering the CALCULATE Function. The objective is to interpret all the elements on the report that make the Initial Filter Context.
1. Filter Context in Action: Row
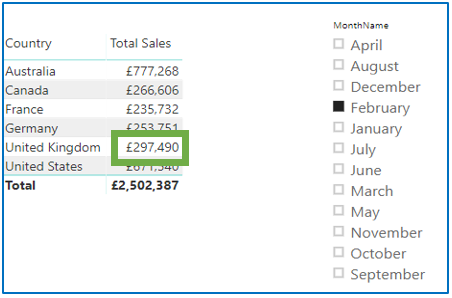
Looking at the below cell highlighted in green within the Matrix, lets understand how this value is evaluated, we must ask ourselves:
What is the Initial Filter Context for this particular cell?
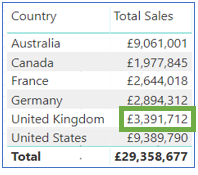
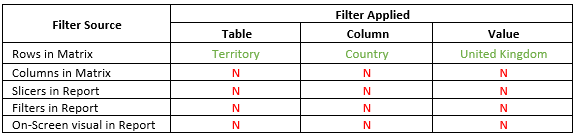
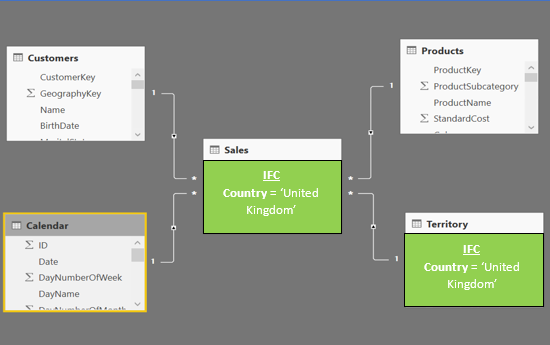
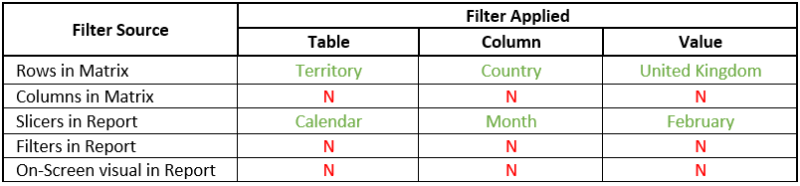
At the start of my Power BI journey, I initially used the below matrix to assist me in identifying the Initial Filter Context for a particular cell. I quickly grew out of this but found it useful in triggering the right thinking. So, the Initial Filter Context for the highlighted cell is only coming from the Rows in the Matrix from Territory[Country] = United Kingdom, as the below matrix displays:
We now know how to read the Initial Filter Context of a particular cell. Slowly you will start to mentally visualise how the Initial Filter Context is applied to the underlying model. To make more sense of this now, let’s walk through the steps taken to propagate the Initial Filter Context:
- All rows are filtered in the Territory Table (Dimension) to display rows for ‘United Kingdom’.
- Those filtered records are propagated down the relationship from the ‘one’ to ‘many’ side.
- The Sales Table (Fact) only exists with those filtered records.
It is very important to understand that the above three steps always take place for each individual cell and only once they do, does the DAX formula evaluate.
2. Filter Context in Action: Row & Slicer
We must ask ourselves once again:
“What is the Initial Filter Context for this particular cell?”
To read the Initial Filter Context for the highlighted cell above in green, this time it goes beyond the Rows in the Matrix. Use the below Matrix to identify the Initial Filter Context:
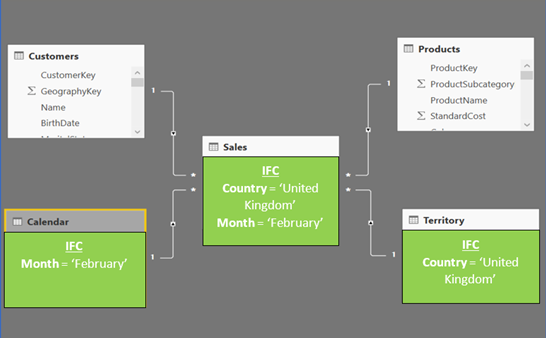
The Initial Filter Context is propagated through the below steps. Once again, these steps always take place for each cell individually and only once they do, does the DAX formula evaluate:
- All rows are filtered in the Territory Table (Dimension) to display rows for ‘United Kingdom’ and in the Calendar Table (Dimension) to display rows for ‘February’.
- Those filtered records are propagated down the relationship from the ‘one’ to the ‘many’ side.
- The Sales Table (Fact) only exists with those filtered records.
3. Filter Context in Action: Slicer
Let’s start of with the most important question:
“What is the Initial Filter Context for this particular cell?”
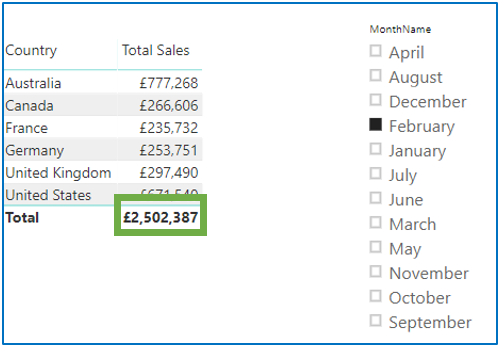
The purpose of this example is to understand how Grand Totals and Sub Totals work with the Initial Filter Context.
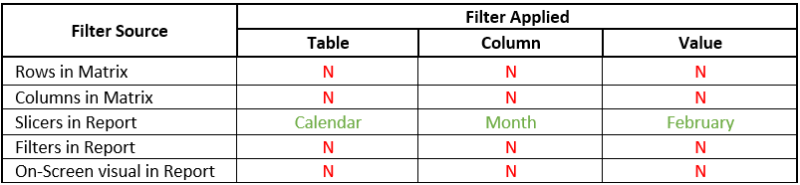
For the above example, the IFC is not being filtered by an individual Row of Territory[Country]. In fact, the Grand Total is un-filtered from the Territory[Country], but it does get filtered by a Slicer in the report. It’s important to understand that the IFC for the highlighted cell is only the Slicer containing Calendar[MonthName] and not the Rows in the Matrix with Territory[Country].
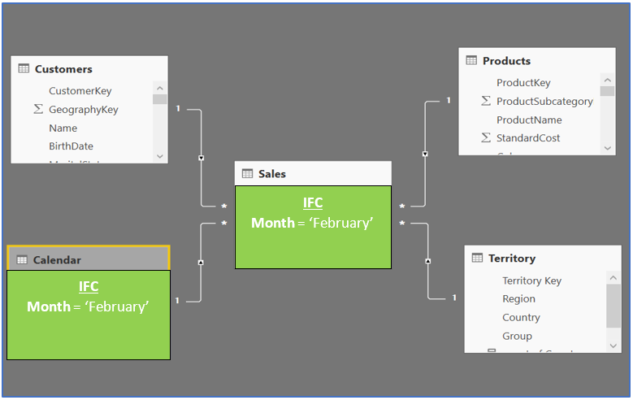
As always, the Initial Filter Context propagates as the below steps explain:
- All rows are filtered in the Calendar Table (Dimension) to display rows for ‘February’.
- Those filtered records are propagated down the relationship from the ‘one’ to the ‘many’ side.
- The Sales Table (Fact) only exists with those filtered records.
4. Filter Context in Action: Rows, Column, Slicer & Filter
For the last time we need to ask the all famous question:
“What is the Initial Filter Context for this particular cell?”
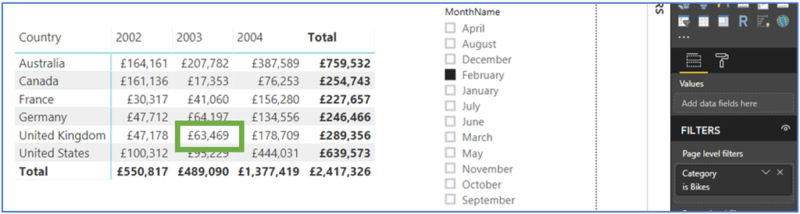
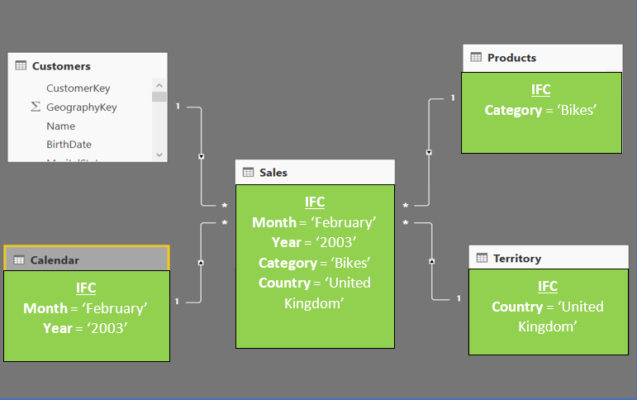
The Initial Filter Context for the above highlighted cell is coming from multiple elements which are defined in the matrix below:
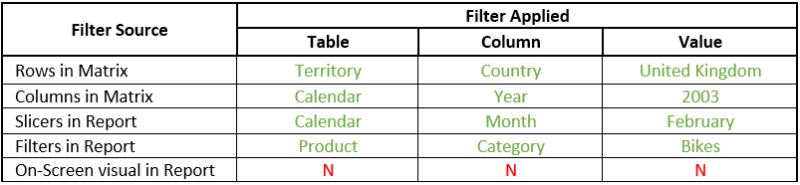
Even though much more is happening in this example compared to the previous, the propagation of the Initial Filter Context still works through the three steps, resulting in the below:
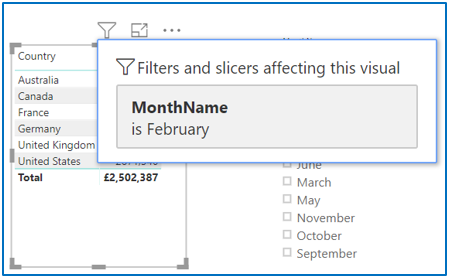
Tip: Filter Icon
A recent feature in Power BI called ‘Filter Icon’ is great way to identify the Initial Filter Context of a visual. Through a simple click, you can identify:
- Slicers affecting visual
- Filters affecting visual
- Other on-screen visuals affecting visual
But not the Rows and Columns of the Matrix itself. Regardless, it is a very useful feature which you can use to identify the IFC.
Summary of Filter Context
What is the difference between Evaluation Context and Filter Context?
- Answer: Filter Context is a type of Evaluation Context.
What is applied as part of the Filter Context?
- Answer: Rows, Column, Slicers, Filters, On-Screen Visuals, CALCULATE Function
What is Initial Filter Context (IFC) and what difference does it hold with Filter Context?
- Answer: Initial Filter Context (IFC) does not consider the CALCULATE Function
How do we read the Initial Filter Context?
- Answer: “The IFC for this cell is Table[Column] = Value”
Does Evaluation Context apply before the DAX formula Evaluates?
- Answer: Yes
Are Grand Total/Sub Totals treated differently with Initial Filter Context?
- Answer: No, they are not an exception. Remember, always ‘read’ the cell.
Does the Filter Icon display the IFC?
- Answer: Partially, it displays everything apart from filters coming from Rows/Columns.
Row Context
Row Context is a special iterating mechanism which takes into consideration the row it is currently on at the time that the DAX formula is evaluated.
When thinking of Row Context, imagine each row in a table being a house. The Row Context will be the postman. The evaluation of the DAX formula is the delivery being made. The postman (Row Context) must visit each house (Row) in order to complete a delivery (Evaluation). This is how I initially start thinking of Row Context. Row Context is applied when we use: Calculated Columns, X-Functions and the FILTER() function.
Row Context: Calculated Column
To make more sense of Row Context, let’s start off with Calculated Columns which apply Row Context. Take a look at the below Calculated Column:
Margin £ = Sales[SalesExcVAT] – Sales[SalesCost]
From our current understanding of Row Context and looking at the above DAX formula, the first question that might come to mind is “how does it know which row to start on?” Well the answer is simple. Row Context within a Calculated Column always starts with the first row and finishes on the last row.
It iterates through the entire table the Calculated Column has been placed in, starting with the first row and evaluating the expression, then moving on the second row and evaluating the expression until it repeats the iteration for all records in the table.
Looking at the below screenshot we can see that the Calculated Column ‘Margin £’ has produced a value for each row.
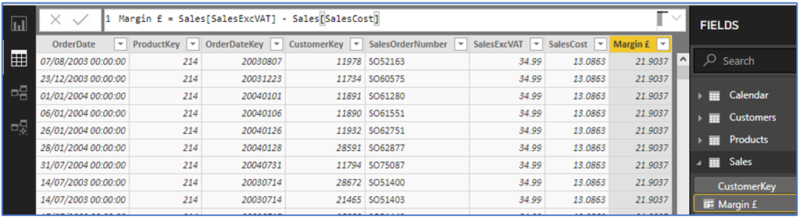
As this Calculated Column has been placed in the Sales Table, this means the Row Context is applied against this table. The Sales Table has a total of 55,327 rows, therefore the Row Context (postman) will visit each of the 55,327 records (houses) and evaluate the expression (make the delivery).
Row Context: X-Functions
We have spoken about Row Context and how this type of Evaluation Context is applied within Calculated Columns. Now let’s move on to another way Row Context is applied: X-Functions such as SUMX, RANKX, COUNTX, etc.
Before we jump into an example, let me highlight this now. The analogy used above for Calculated Columns with the Postman (Row Context) having to visit each and every house (record) in order to complete a delivery (evaluation) is the same with X-Functions. The differences I am aware of are two.
Firstly, the X-Function requires us to specify the table it will iterate through; therefore, we need to map the houses for the Postman. Secondly, the Calculated Column gets stored in your actual model, whilst X-Functions are measures that are not physically stored and only calculated at usage. If you are thinking whether to use a Calculated Column or a Measure and don’t know which to choose, always remember that memory is your biggest asset when working with Power BI. For a more in depth understanding, please check out the sources supplied below.
Margin £ SUMX = SUMX(Sales, Sales[SalesExcVAT] – Sales[SalesCost])
Take a look at the DAX formula above. First thing worth noting is that we declared the ‘Sales’ table. Therefore, we pinpoint each row (house) that needs to be visited.
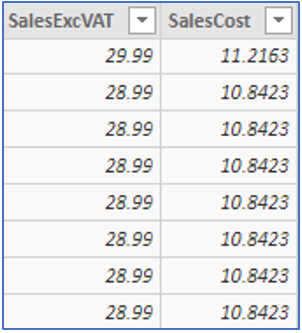
Looking at the table above, the DAX formula will visit the first record and evaluate the expression:
- Record 1 = 29.99 – 11.2163
Then it will move to the second record and repeat the process:
- Record 2 = 28.99 – 10.8423
Then it will move to the third record and repeat the process:
- Record 3 = 28.99 – 10.8423
Until it repeats the same process for each record.
Summary of Row Context
When is Row Context applied?
- Answer: Calculated Columns, X-Functions and Filter Function.
From which row does Row Context begin?
- Answer: In Calculated Columns the first record otherwise the first record of table specified.
What is the core difference between Row Context and Filter Context?
- Answer: Row Context works on a single row at a time and is aware of each individual row, whilst Filter Context refers to the filters applied when a DAX formula is evaluated.
Why can’t I use an aggregator such as SUM, within Row Context?
- Answer: Row Context does not apply Filter Context by default, it must be enabled.
What is Context Transition?
- Answer: The process of transforming the Row Context into Filter Context. Therefore, filters propagating down from one side to many side of tables.
Row Context does not consider Filter Context
A very important part of Row Context is understanding that it does not automatically apply Filter Context. When I first started to write DAX, I remember using a SUM within a Calculated Column. The values in the column were clearly incorrect. Since then I have seen many experience the same outcome at least once, until figuring out that a measure does the trick. But this is not a trick and we should look to understand why this is happening.
To better understand Context Transition, let’s work through an example. Below is the model which we will be working with, which is a simplified version from earlier examples:
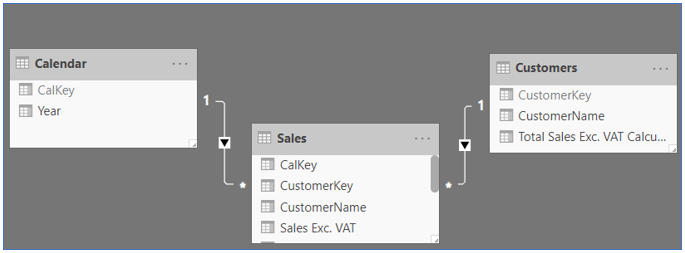
If we add the below DAX Formula as a Calculated Column within the Customers table, what do you think we would get back as a result?
Total Sales Exc. VAT Calculated Column = SUM(Sales[Sales Exc. VAT])
Here is the result:
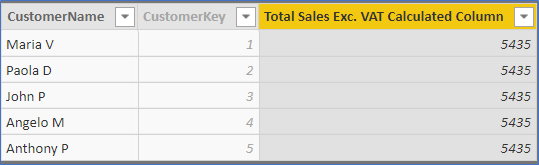
All rows are repeating the value 5435. This value is the total value of ‘Sales Excluding VAT’ that exists in the entire Sales table. The above result proves that Row Context does not automatically apply Filter Context.
This occurs due to the Row Context iterating (visiting) every record in the Customer table and asking, “show me the Total Sales Amount” however no Filter Context exists. This means no filters are applied to the Sales table, at all! To ensure we understand this behaviour, let’s take it step by step:
Go to Record 1 in Customer Table:
- What is the Total Sales Amount for Record 1?
- Sales Table has no filters, therefore return all sales.
Go to Record 2 in Customer Table:
- What is the Total Sales Amount for Record 2?
- Sales Table has no filters, therefore return all sales.
Go to Record 3 in Customer Table:
- What is the Total Sales Amount for Record 3?
- Sales Table has no filters, therefore return all sales.
The all-important question here is: How do we apply Filter Context in the Row Context? This is done through:
Context Transition
Context Transition is outside the scope of this read, however we will scrape the surface of this concept. I would highly recommend you check out the sources below, for a deeper dive into Context Transition.
How do we apply Filter Context to Row Context?
Row Context does not consider Filter Context. This is so important to remember that it is worth repeating. To convert Row to Filter Context we must use the power of the CALCUALTE Function! The CALCULATE Function with no filter parameters has the job of applying Context Transition.
Look at the same DAX formula from above, only this time it is wrapped within the CALCULATE Function.
Total Sales Exc. VAT (Calculated Column) = CALCUALTE(SUM(Sales[Sales Exc. VAT]))
As you can see below, we get the correct result:
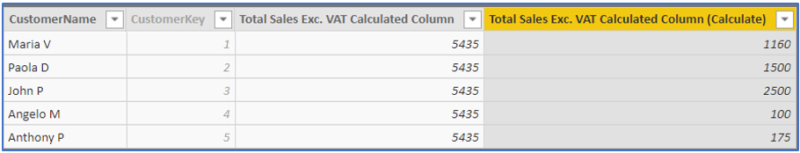
The CALCULATE Function enables Filter Context; therefore, it converts the Row Context into Filter Context. The power of the CALCULATE Function! In more detail, the filters on the Customer table propagate down the relationship to the Sales Table for each record.
Summary:
If someone truly wants to learn Power BI, DAX is something that should not be avoided and for this reason Evaluation Context should be high on the to-learn list. This article should have armed you with the knowledge needed to interpret DAX behaviour, as well as easily digest more in-depth articles on Evaluation Context.
@Data_Laz
Sources:
Matt Allington. (2018). Supercharge Power BI. Holy Macro! Books.
Marco Russo & Alberto Ferrari (2015). The Definitive Guide to DAX. Microsoft Press Store.


This is on my Bookmark Page, I felt its very clear explanation of evaluation context. Thank you for bringing out this article.
Question : Under Filter Icon, Shouldn’t there be Product.Category = bikes (as this is Filter on Report) ?
Hey AK! I am happy to hear that you found this blog useful.
In regards to the Filter Icon, from the screenshot i posted, i only have a Slicer with MonthName = ‘Febrarury’. However, if i did add the Product.Category = ‘Bikes’, it would have also displayed in the Filter Icon.