The long awaited Python Integration in Power BI added earlier this month welcomes the opportunity for further customised reporting by exploiting the vast range of Python visualisation libraries.
Among my favourite of these Python visualisation/ data science libraries is NetworkX, a powerful package designed to manipulate and study the structure and dynamics of complex networks. While NetworkX excels most at applying graph theory algorithms on network graphs in excess of 100 million edges, it also provides the capability to visualise these networks efficiently and, in my opinion, easier than the equivalent packages in R.
In this article, I will explain how to visualise network data in Power BI utilising the new Python Integration and the NetworkX Python library.
Getting Started
To begin experimenting with NetworkX and Python in Power BI, there are several pre-requisites:
- Enable Python integration in the preview settings by going to File -> Options and Settings -> Options -> Preview features and enabling Python support.

- Ensure Python is installed and fully up-to-date.
- Install the following Python libraries:
- NetworkX
- NumPy
- pandas
- Matplotlib
Loading Data
The data I used was created to demonstrate this task in Power BI but there are many real-world network datasets to experiment with provided by Stanford Network Analysis Project. This small dummy dataset represents a co-purchasing network of books.
The data I loaded into Power BI consisted of two separate CSVs. One, Books.csv, consisted of metadata pertaining to the top 40 bestselling books according to Wikipedia and their assigned IDs. The other, Relationship.csv, was an edgelist of the book IDs which is a popular method for storing/ delivering network data. The graph I wanted to create was an undirected, unweighted graph which I wanted to be able to cross-filter accurately. Because of this, I duplicated this edgelist and reversed the columns so the ToNodeId and FromNodeId were swapped. Adding this new edge list onto the end of the original edgelist has created a dataset with can be filtered on both columns later down the line. For directed graphs, this step is unnecessary and can be ignored.
Once loaded into Power BI, I duplicated the Books table to create the following relationship diagram as it isn’t possible to replicate the relationship between FromNodeId to Book ID and ToNodeId to Book ID with only one Books table.

From here I can build my network graph.
Building the Network Graph
Finally, we can begin the Python Integration!
Select the Python visual from the visualizations pane and drag this onto the dashboard.

Drag the Book Title columns of both Books and Books2 into Values.

Power BI will create a data frame from these values. This can be seen in the top 4 lines in the Python script editor.

The following Python code (also shown above) will create and draw a simple undirected and unweighted network graph with node labels from the data frame Power BI generated:
import networkx as nx
import matplotlib.pyplot as plt
G = nx.from_pandas_edgelist(dataset, source="Book Title", target="Book Title.1")
nx.draw(G, with_labels = True)
plt.show()
** NOTE: You may find that the code above will fail to work with large networks. This is because by default networkx will draw the graph according to the Fruchterman Reingold layout, which will position the nodes for the highest readability. This layout is unsuitable for networks larger than 1000 nodes due to the memory and run time required to run the algorithm. As an alternative, you can position the nodes in a circle or randomly by editing the line
nx.draw(G, with_labels = True)
to
nx.draw(G, with_labels = True, pos=nx.circular_layout(G))
or
nx.draw(G, with_labels = True, pos=nx.random_layout(G))
**
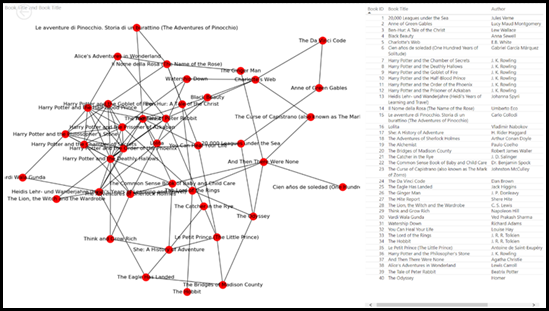
This will produce the network graph below:

You are also able to cross filter the network graph by selecting rows in the table on the right-hand side:

Conclusion
Python visuals are simple to produce and although the visual itself isn’t interactive, they will update with data refreshes and cross filtering, much like the R integration added 3 years ago. The introduction of Python in Power BI has opened doors for visualisation with libraries such as NetworkX, to visualise all BI networks from Airline Connection Flights and Co-Purchasing networks to Social Network Analysis.
Introduction to Data Wrangler in Microsoft Fabric
What is Data Wrangler? A key selling point of Microsoft Fabric is the Data Science
Jul
Autogen Power BI Model in Tabular Editor
In the realm of business intelligence, Power BI has emerged as a powerful tool for
Jul
Microsoft Healthcare Accelerator for Fabric
Microsoft released the Healthcare Data Solutions in Microsoft Fabric in Q1 2024. It was introduced
Jul
Unlock the Power of Colour: Make Your Power BI Reports Pop
Colour is a powerful visual tool that can enhance the appeal and readability of your
Jul
Python vs. PySpark: Navigating Data Analytics in Databricks – Part 2
Part 2: Exploring Advanced Functionalities in Databricks Welcome back to our Databricks journey! In this
May
GPT-4 with Vision vs Custom Vision in Anomaly Detection
Businesses today are generating data at an unprecedented rate. Automated processing of data is essential
May
Exploring DALL·E Capabilities
What is DALL·E? DALL·E is text-to-image generation system developed by OpenAI using deep learning methodologies.
May
Using Copilot Studio to Develop a HR Policy Bot
The next addition to Microsoft’s generative AI and large language model tools is Microsoft Copilot
Apr