Can we predict peoples’ sporting performance by knowing some details about them?
If so, what is better at making these predictions: machines or humans?
These questions seem so interesting so we decided to answer them; by creating a working IT solution to see how it would perform.
The blog will provide an overview of the project providing a simple results analysis and details of technologies that we used to make it happen.
As It would be hard to check all available sport disciplines we decided to focus on the one we love the most – Cycling. Our aim was to predict the maximum distance a rider would ride within one minute from standing start. Although “one minute” sounds insignificant, this is really tough exercise as we were simulating quite a tough track.
We used the following equipment to perform the experiment:
- bike with all necessary sensors to enable recording of speed, cadence, crank turns, wheel turns, distance
- velodrome bike simulator
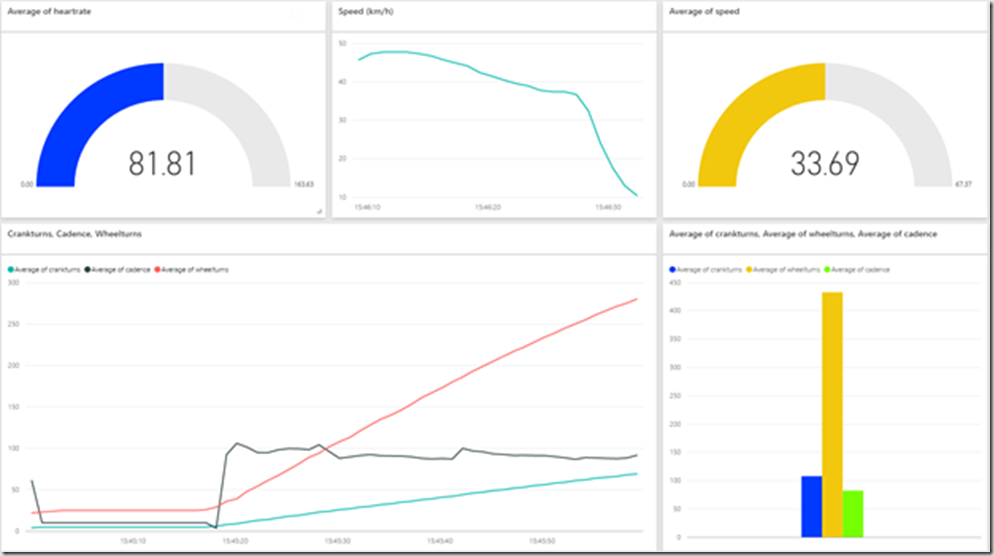
- heart rate monitor in form of wrist bandUsing this equipment allowed us to capture data about the ride in real time and display this using streaming analytics and Power BI in a live interactive dashboard as shown below (Picture 1):
Picture 1: Real time Power BI dashboards showing: average heart rate(top row left); current speed in km/h(top row middle); average of speed(top row right); Current Crank turns, wheel turns and cadence(bottom row Left); Average of Crank turns, wheel turns and cadence (bottom row right)
- Sensors were used to capture information about how fast our rider was cycling, how many crank turns they made, what was their heart rate during the ride and the most important – how far they did go within the time limit.
Each rider had a chance to try to predict their maximum distance before their ride. We also made a prediction based upon previous cyclist results using Machine Learning algorithms.
In order for the Machine Learning Algorithms to make estimates about each of the riders, we had to capture some representative properties about each rider before the ride. All riders needed to categorise themselves for each of properties listed below:
- age
- height
- weight
- gender
- smoking volume
- drinking volume
- cycling frequencySo taking weight as an example, people were asked to allocate themselves to the one out of the available buckets:
e.g.
- Bucket 1 – 50-59kg,
- Bucket 2 – 60-69kg,
- Bucket 3 – 70-79kg
- …
- Bucket N – Above 100kg
- Bucketing properties were used to help us reduce amount of distinct values, so it increased the probability that for a given ride we would find someone with similar characteristics, who had already had a ride.
Obviously to make the prediction work we had to have an initial sample. That’s why we asked “Adatis people” to have a go on Friday afternoon. In true competitive spirit some of them even tried a few times a day! By the beginning of the SQLBits conference we had managed to save details of around 40 different rides.
In a nutshell let me describe the process that we repeated for each rider.
First step was to capture details of the volunteer by using ASP.NET Web app, including the maximum distance they think they will be able to reach (human prediction). Next, behind the scenes we provided their details to the machine learning algorithm exposed as web service to get a predicted distance. We then turned on all sensors and let the cyclist ride the bike. During the ride we captured all the data from the sensors and transferred it to the database through the Azure IoT stack. After the ride finished we updated the distance reached by the rider. The more cyclists participated, the bigger sample size we had to predict result for the next rider.
Overall we captured 150 rides for 138 different riders. The initial sample size we used to make prediction was 40 riders and it grew up as more riders got involved.
The table below (Table 1) contains basic statistics of the differences between the machine learning predictions and human predictions.
Prediction Type
Avg. Difference
Std. Dev. For Difference
Max Difference
Min Difference
Azure Machine Learning 119m 87m 360m 2m Humans 114m 89m 381m 0m Table 1: Absolute difference between Predicted and Reached distance for 1 minute ride. (Average distance reached 725m)
From these numbers we can easily see that neither Humans nor Machine Learning came close to the real results reached by riders. The average difference over a 725m ride was 114m for humans with a standard deviation of 89 meters and 119 with a standard deviation of 87 meters. That means both of them were equally inaccurate. Although it is worth mentioning that we had single cases when the prediction was very close or even equal to the one reached. In trying to determine the reason behind the miscalculations in the ML prediction? I would say that the main reason is the sample size was not sufficient to make accurate predictions. Besides the small l sample there might be other reasons why predictions were so inaccurate such as:
- Incorrect bucket sizes for rider properties
- Too many properties to make a match
- Lack of strong enough correlation between properties and distance reached
-
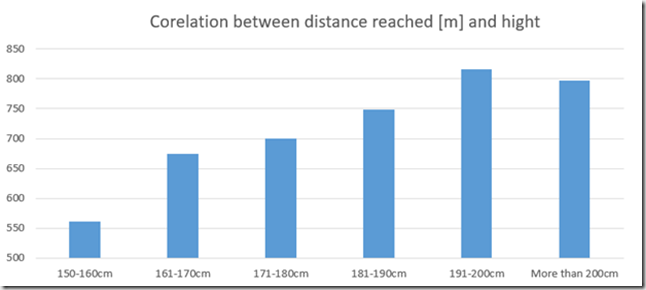
It is also worth mentioning that some properties would show high correlation between property and distance like height of the rider or low correlation like drinking volume.
The Best examples of high correlation we can see are on the charts attached below (Chart 1):
Chart 1: Correlation between distance reached in meters and height category of the rider
-
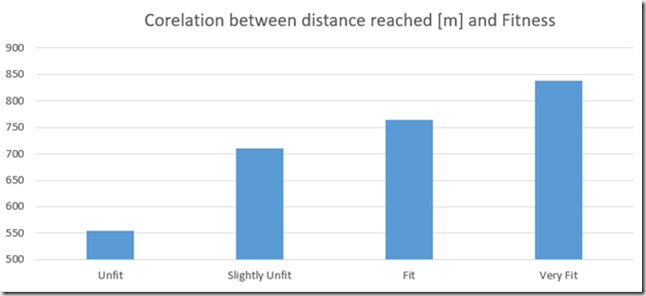
And even more significant regarding fitness level (Chart 2):
Chart 2: Correlation between distance reached in meters and fitness category of the rider
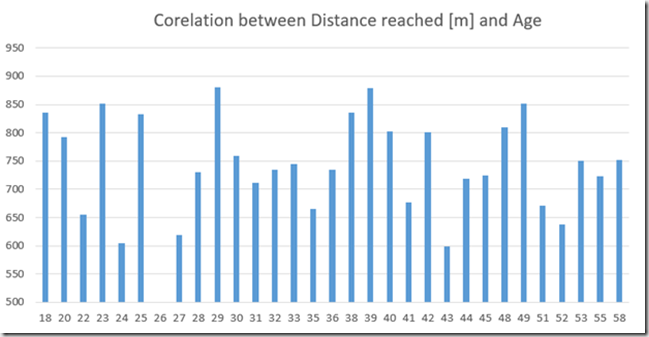
On the other hand, some rider’s properties did not show the correlation that we would expect e.g. age (Chart 3)
Chart 3: Correlation between distance reached in meters and age of the rider
Although there is no straightforward correlation as previously stated we can observe a general trend that we tend to perform better the closer we get to our round birthdays. We can observe peaks at the ages of 18, 29, 39, 49. Is it perhaps because of the fear of getting to the next decade?
I will leave this up to your interpretation…
If you are interested into more technical explanation how we designed and build our project, I would like to invite you to the second part of the blog that would cover top level architecture of the project and also some deep insights into some core technologies used including: Azure Stream Analytics, Azure Event Bus, PowerBI web, ASP.NET MVC4 and SignalR.


Introduction to Data Wrangler in Microsoft Fabric
What is Data Wrangler? A key selling point of Microsoft Fabric is the Data Science
Jul
Autogen Power BI Model in Tabular Editor
In the realm of business intelligence, Power BI has emerged as a powerful tool for
Jul
Microsoft Healthcare Accelerator for Fabric
Microsoft released the Healthcare Data Solutions in Microsoft Fabric in Q1 2024. It was introduced
Jul
Unlock the Power of Colour: Make Your Power BI Reports Pop
Colour is a powerful visual tool that can enhance the appeal and readability of your
Jul
Python vs. PySpark: Navigating Data Analytics in Databricks – Part 2
Part 2: Exploring Advanced Functionalities in Databricks Welcome back to our Databricks journey! In this
May
GPT-4 with Vision vs Custom Vision in Anomaly Detection
Businesses today are generating data at an unprecedented rate. Automated processing of data is essential
May
Exploring DALL·E Capabilities
What is DALL·E? DALL·E is text-to-image generation system developed by OpenAI using deep learning methodologies.
May
Using Copilot Studio to Develop a HR Policy Bot
The next addition to Microsoft’s generative AI and large language model tools is Microsoft Copilot
Apr