Predicting data is nothing new in the Microsoft BI world, with the data mining capabilities in Analysis Services, but there is now another option – namely Azure ML, Microsoft’s cloud based predictive analytics solution. Like many people, I’ve been keen to see what Azure ML can do. Luckily, you can still sign up for a completely free trial for Azure, meaning you can be up and running with Azure ML in a matter of minutes.
For this blog post I’ve selected an insurance use case scenario, as I’ve been working in the insurance industry quite a bit over the past couple of years. My reason for using Azure ML is that I would like to see if it’s possible to predict the retention rate, i.e out of all our policies that were due for renewal, what percentage of those policies actually renewed? Therefore I’m going to try and predict whether a car policy holder will renew based on a dataset comprising of previous policies that show whether or not the policy was renewed.
Loading Data
I didn’t want to use real data for this example, so I’ve got some made up data, which I’ve saved as a simple CSV. Thankfully this can be easily uploaded to Azure using ML Studio, which is the main development tool for Azure ML:
Experiments
Having uploaded my test dataset, I’m ready to build a predictive model. Azure ML allows me to do this by creating an experiment, which is to ML Studio what a project is to Visual Studio. Within ML Studio, the starting point is to pick a dataset. Data can be consumed from a variety of sources, such as SQL Azure, Azure Blob Storage and http to name a few. But in this case I’m going to use my csv file, which is available under Saved Datasets, along with a host of other ‘modules’ that perform various tasks within ML. The modules can be dragged and dropped onto the canvas, so the starting point is to drag the insurance dataset onto the canvas:
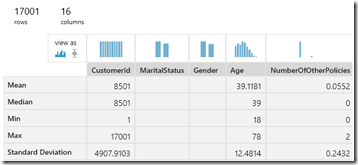
Once I have a dataset on the canvas, I can right click on the saved dataset and choose Visualize, which will profile my data for me, showing me statistics such as the minimum, maximum and standard deviation for each column:
There are a myriad of factors that could potentially affect the retention rate, such as renewal price, number of other policies held (e.g. perhaps they have both life and car insurance with the insurance company), how long the policy holder has been a customer, as well as make/model, insurance add-ons (legal cover, hire car cover) age and other demographics to name a few. I’ve not got all of these factors in my dataset, but I have a fair few, just to show an example.
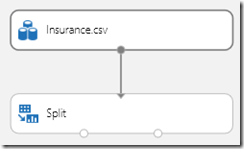
Once I’ve got my insurance dataset, the next task is to add a Split module, which will allow me to split the rows into two buckets, in a 75%/25% split. Firstly, a training set is needed, which will be fed into the actual model, allowing it to learn based on the past data. The other bucket will be the test set in this case, which will be used to test how the trained model performs. Here you can see the two dots at the bottom of the Split module are the two outputs:
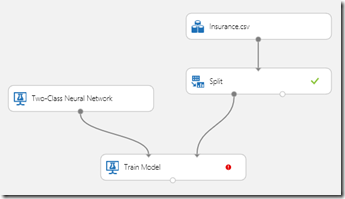
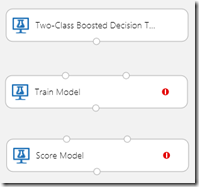
The next task is to drag a Train Model onto the canvas and then connect the training set to the second input of the Train Model. For the first input, the Train model is expecting an input of untrained learner, so I’ve given it the input of an untrained Two-Class Neural Network. The second input expected by the Train Model is a dataset, which is the training set that comes from the Split. Therefore we now have the following shape to the experiment:
The red icon on the train model indicates that there is no column selected, so therefore I’ve picked the column “Renewed” (Yes/No) from the column selector to indicate that this is the outcome that we wish to predict.
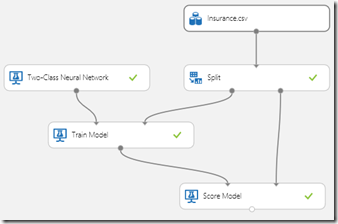
In addition, we need to add a Score Model, which will allow us to score the now trained model against the test dataset. Therefore the Score Model accepts two inputs, namely a Trained Model and the test dataset:
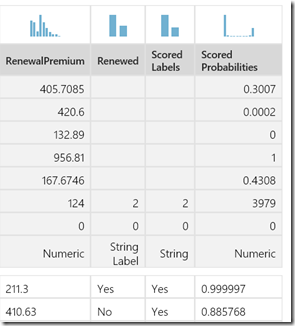
If I now run the experiment then we can click on the Visualize option on the output of the Score Model. This will show a comparison of the predicted outcome against the outcome on the test dataset, on a row by row basis:
Finally we can add in an Evaluate Model, which will measure the performance of the model using a specific set of metrics. Again we can choose the Visualize option, which will give us metrics such as True/False Positive/Negative and Cumulative AUC:
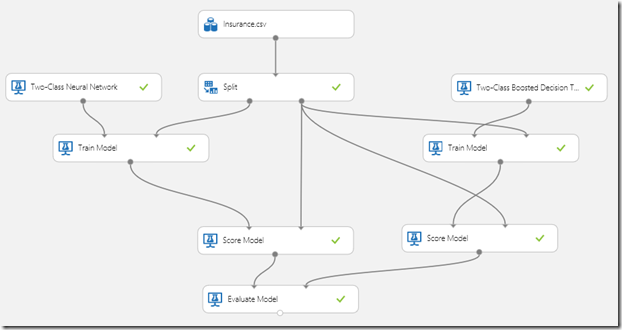
What I think’s great about Azure ML is that its very easy to compare the performance of the Neural Network to other models. Therefore I can add in a Boosted Decision Tree, another Train Model and also another Score Model:
These can be quickly wired up to the relevant inputs. The final step is then to then set the Evaluate Model to accept a second input, which is the output of the second Score model. It all ends up looking like this:
As you can see, we now have two inputs into the Evaluate Model, which will allow us to compare the performance of the two models that have been chosen. In this example, when choosing Visualize on the Evaluate model, I can see that the Two Class Boosted Decision Tree gave the best overall results:
The final result is that we have a model that is capable of predicting whether a policy holder is likely to renew or not. Of course this is just a quick example but it hopefully gives you an idea of what Azure ML is capable of.




Introduction to Data Wrangler in Microsoft Fabric
What is Data Wrangler? A key selling point of Microsoft Fabric is the Data Science
Jul
Autogen Power BI Model in Tabular Editor
In the realm of business intelligence, Power BI has emerged as a powerful tool for
Jul
Microsoft Healthcare Accelerator for Fabric
Microsoft released the Healthcare Data Solutions in Microsoft Fabric in Q1 2024. It was introduced
Jul
Unlock the Power of Colour: Make Your Power BI Reports Pop
Colour is a powerful visual tool that can enhance the appeal and readability of your
Jul
Python vs. PySpark: Navigating Data Analytics in Databricks – Part 2
Part 2: Exploring Advanced Functionalities in Databricks Welcome back to our Databricks journey! In this
May
GPT-4 with Vision vs Custom Vision in Anomaly Detection
Businesses today are generating data at an unprecedented rate. Automated processing of data is essential
May
Exploring DALL·E Capabilities
What is DALL·E? DALL·E is text-to-image generation system developed by OpenAI using deep learning methodologies.
May
Using Copilot Studio to Develop a HR Policy Bot
The next addition to Microsoft’s generative AI and large language model tools is Microsoft Copilot
Apr