
In PerformancePoint Planning Server there are several pre-defined model types that satisfy different requirements. One of these model types is Financial Model with Shares Calculations and its primary use is for the financial consolidation of a group of companies where the ownership of the companies within the group is not 100%.
Take the following international group of companies:
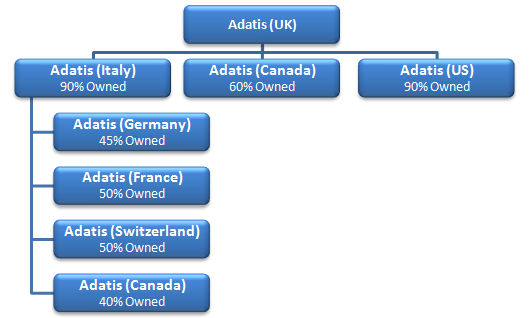
Adatis (UK) is the ultimate parent (and in this case the holding company too) and own a 90% shareholding of Adatis (Italy) and Adatis (US). Adatis (Canada) is only 60% owned, although notice that Adatis (Italy) owns the remaining 40% of Adatis (Canada). Adatis (France) and Adatis (Switzerland) are both 50% owned by Adatis (Italy) who also owns 45% of Adatis (Germany).
In order to work out the consolidated accounts of the Adatis (UK) Group, one of the first steps is to determine the effective ownership of each of the companies within the group. This needs to be done from the perspective of the holding company.
What do I mean by effective ownership? I mentioned earlier that Adatis (Canada) was 60% owned directly by Adatis (UK) and 40% owned by Adatis (Italy). So you would be forgiven by thinking that Adatis (Canada) is 100% owned within the group albeit split between two of the companies.
However, notice t hat Adatis (Italy) is only 90% owned. This means that Adatis (UK) only effectively owns 90% of the 40% of Adatis (Canada) plus the 60% it owns directly. Therefore, the effective ownership is 90% of 40% = 36% + 60% = 96%.
Below outlines the effective ownership from the perspective of Adatis (UK) for the entire group.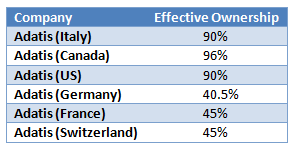
PerformancePoint Server ‘With Shares’ Financial Model contains a built in Shares Calculation job that should, in theory, determine the effective ownership for a group of companies.
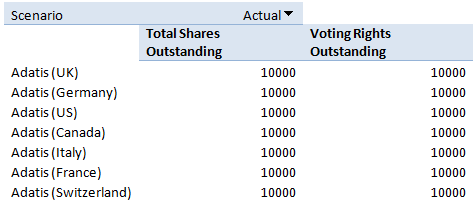
In order to test the PerformancePoint Shares Calculations you need to load data into two of the three additional measure groups that are automatically created in a ‘With Shares’ Financial Model.
Shares Outstanding
Each company needs a set of shares issued and the number of those shares that have voting rights. To keep everything simple I’ve issued all companies with 10000 shares with all shares having voting rights.
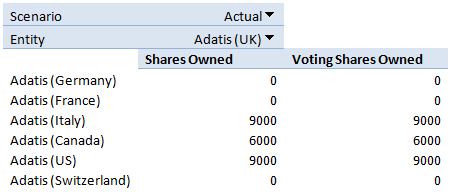
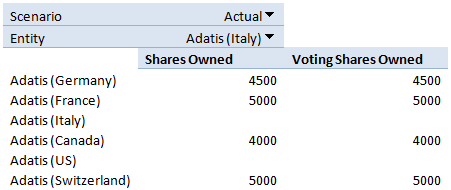
Shares Owned
For each of the parent companies the share ownership needs specifying. We have two parent companies, Adatis (UK) and Adatis (Italy). The shares owned have been set according to our company breakdown illustrated above.
Adatis (UK) owned companies
Adatis (Italy) owned companies
Control and Ownership
With the data loaded the shares calculation job can be executed. The results are posted to the third of the additional measure groups, Control and Ownership.
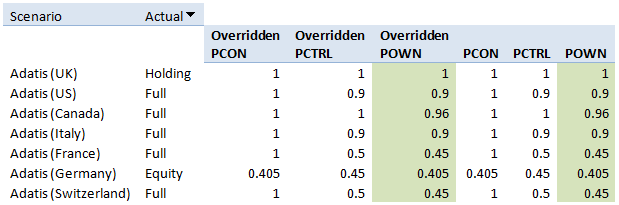
It’s the POWN columns, highlighted, that contain the effective ownership and encouragingly this matches our expectation. So it looks like, under these simple conditions the Shares Calculation job does what it should.
Incidentally, there are a few additional columns that are of interest.
– The PCON columns are the percentage that will be used in the consolidation.
– The PCTRL (Ultimate Percent Control) columns specify the controlling percentage. This is essentially controlled by the number of voting shares compared to shares owned and effective ownership.
– The ‘Overridden’ equivalents can be used to override the results of the shares calculation job and are the actual values used in the consolidation process. The non-overridden columns exist to show the outcome of the calculation. These can be altered but will have no effect as they are not used in the consolidation process itself.
– The final additional column represents the Consolidation Method. There is a simple formula that PPS uses to determine the Consolidation Method:
o If the ultimate percent control (PCTRL) is >= 0.0 and < 0.2, the consolidation method is NONE.
o If the ultimate percent control (PCTRL) is >= 0.2 and < 0.5, the consolidation method is Equity.
o If the ultimate percent control (PCTRL) is >= 0.5 and <= 1.0, the consolidation method is Full.
o If the entity is the holding company for the model, the consolidation method is Holding.
It’s important to note that there is no automatic way of setting a proportionally consolidated company. The consolidation method can be changed and will need to be changed if, for example, you wanted to proportionally consolidate Switzerland, and/or France as opposed to the Full consolidation by default.
Introduction to Data Wrangler in Microsoft Fabric
What is Data Wrangler? A key selling point of Microsoft Fabric is the Data Science
Jul
Autogen Power BI Model in Tabular Editor
In the realm of business intelligence, Power BI has emerged as a powerful tool for
Jul
Microsoft Healthcare Accelerator for Fabric
Microsoft released the Healthcare Data Solutions in Microsoft Fabric in Q1 2024. It was introduced
Jul
Unlock the Power of Colour: Make Your Power BI Reports Pop
Colour is a powerful visual tool that can enhance the appeal and readability of your
Jul
Python vs. PySpark: Navigating Data Analytics in Databricks – Part 2
Part 2: Exploring Advanced Functionalities in Databricks Welcome back to our Databricks journey! In this
May
GPT-4 with Vision vs Custom Vision in Anomaly Detection
Businesses today are generating data at an unprecedented rate. Automated processing of data is essential
May
Exploring DALL·E Capabilities
What is DALL·E? DALL·E is text-to-image generation system developed by OpenAI using deep learning methodologies.
May
Using Copilot Studio to Develop a HR Policy Bot
The next addition to Microsoft’s generative AI and large language model tools is Microsoft Copilot
Apr