As a BI Consultant, I regularly sit down with a new/prospective client and dissect both their business requirements and source data. With the latter, the SSIS Data Profiling Task (in Visual Studio or SSDT) is a very useful tool to find out the general quality of the data we will be importing into the warehouse. Count of NULLS, Value frequency, Min/Max/Median Values and unique count of records are just a few types of data profiling.
I have recently being playing with the out of the box Data Profiling functionality in Power Query. Although the functions are very useful, I quickly realised that I would need to extend my PowerBook to match the Data Profiling Task in SSIS. I will break my findings down into a couple of parts, with this installment focusing on a specific data profiling output from SSIS.
Table Profile Function
Table.Profile() is a relatively new function in Power Query that gives some profiling stats for columns in a specific database table or raw file. In the example below, I pulled in a raw Excel spread sheet from the Power BI website, which contains sample financial data. Click here to download the data.
To obtain stats on this query, open Advanced Editor, add the following M at the end of the existing code:
#”TableProfiling” = Table.Profile( #”Changed Type” as table) as table
in
#”TableProfiling”
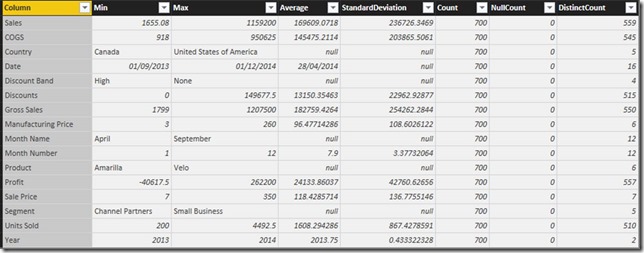
All we are doing is creating a new step in M, referencing the previous step and calling the new one. The actual Table.Profile() function doesn’t even require an expression value and the underlying Power Query engine provides all of the functionality. Each column has been profiled – see below:
I think the outputs are self-explanatory, especially if you are familiar with Data Profiling. Either way, one line of code gives us some useful high level stats about the data and can help us captures the extremes or anomalies of each column. Not all analysis will be suitable for a column, e.g. the ‘Country’ field will not produce Standard Deviation or Average values because it uses the Text datatype.
Column/Frequent Value Distribution
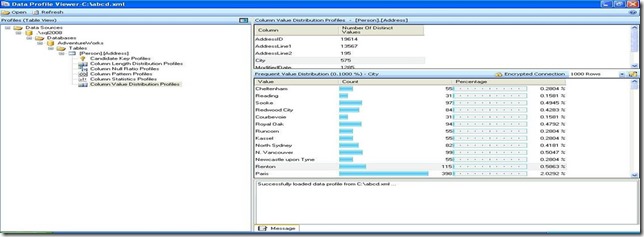
Whilst the in-built Power Query function is ideal for overall table/file analysis, data profiling is most effective when focusing on specific columns and data patterns. Both Column and Frequent Value Distribution are basic features of the SSIS Profiling Task, shown below.
For the Power Query proof of concept, I have connected to AdventureWorksDW2014 and the Person.Address table – named PersonAddress. This means I can use the SSIS Data Profiling screenshot as the benchmark to not only prove it can be replicated, but to ensure the numbers match.
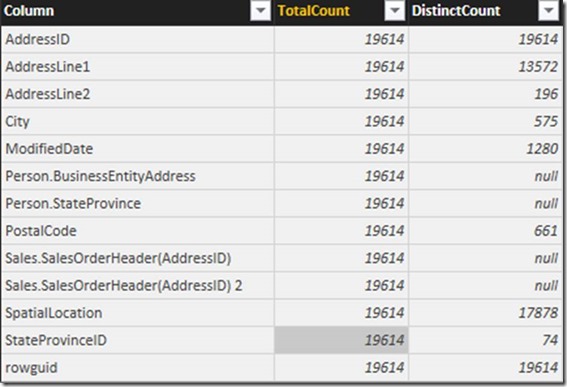
The first step is to apply the Table.Profile() function to a Reference query – called TableProfiling. We can then create a simple staging query that just includes what we need from the out of the box profiling – called TableProfilingStage. ‘Number of Values’ is renamed to ‘TotalCount’ and ‘Number of Distinct Values’ to ‘DistinctCount’. We are left with the following data:
The row of interest is ‘City’ (contained in Column), as this is what we need to profile. The queries TableProfilingStage is the reference point for the frequent value distribution. Create a New Source and paste the following M Code into the Advanced Editor:
Points of note:
1. Lines 1-4 are referencing parameters in other queries and more specifically, with the ordinal position of 3. The ‘City’ column is the 4th record in TableProfilingStage which equates to position 3 (column 1 starts at 0).
2. Each ‘City’ value summed with a total count.
3. Individual record counts (value of 1 per row) to use in the eventual calculation. This value is then summed to give a total record count on each row.
4. Apply (Count/TotalCount)*100 to work out the Frequent Value Distribution.
5. Renamed, sorted (by count) and hidden any unnecessary columns.
6. Save your new query – I called it ColumnProfiling.
7. You should have 4 queries in total:
a. PersonAddress
b. TableProfiling
c. TableProfilingStage
d. ColumnProfiling
As long as your queries are named identically to my examples, you will end up with the below outputs:
Column Value Distribution:
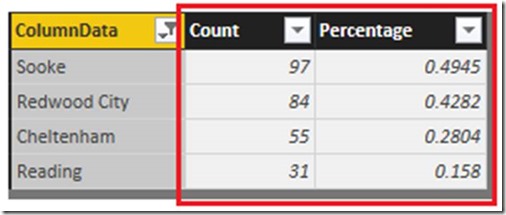
Frequent Value Distribution:
We have now replicated Column and Frequent Value Distribution and the figures matches the SSIS Profiling Task! Although Power Query does not provide the pretty visualizations, we can easily re-produce them in the Power BI reporting suite. I will save this for another blog, though.
Next Steps
Look out for my next blog, where I aim to enhance the current Data Profiling PowerBook and add configuration. In order to make this method as or more efficient than SSIS, it will need to be automated and handle a number of sources (e.g. csv, database connection, etc) and incorporate invoked Power Query functions.
Conclusion
It is clear to see that Power Query is a very effective tool to replicate SSIS Data Profiling. I believe with further development, a PowerBook could be used as a quicker and more efficient tool to run data profiling.
I am very interested to see if anyone has created their own Data Profiling tasks in Power Query and welcome any comments, feedback or questions.


Introduction to Data Wrangler in Microsoft Fabric
What is Data Wrangler? A key selling point of Microsoft Fabric is the Data Science
Jul
Autogen Power BI Model in Tabular Editor
In the realm of business intelligence, Power BI has emerged as a powerful tool for
Jul
Microsoft Healthcare Accelerator for Fabric
Microsoft released the Healthcare Data Solutions in Microsoft Fabric in Q1 2024. It was introduced
Jul
Unlock the Power of Colour: Make Your Power BI Reports Pop
Colour is a powerful visual tool that can enhance the appeal and readability of your
Jul
Python vs. PySpark: Navigating Data Analytics in Databricks – Part 2
Part 2: Exploring Advanced Functionalities in Databricks Welcome back to our Databricks journey! In this
May
GPT-4 with Vision vs Custom Vision in Anomaly Detection
Businesses today are generating data at an unprecedented rate. Automated processing of data is essential
May
Exploring DALL·E Capabilities
What is DALL·E? DALL·E is text-to-image generation system developed by OpenAI using deep learning methodologies.
May
Using Copilot Studio to Develop a HR Policy Bot
The next addition to Microsoft’s generative AI and large language model tools is Microsoft Copilot
Apr