If you’re a regular user of PowerBI, you’re probably aware of the size limitations around datasets and it’s very likely you’ve hit them more than once whilst writing reports on top of large datasets. It’s difficult to see where size savings can be made directly through PowerBI, but we can use traditional tabular optimisation techniques to help us!
For those not in the know, a single dataset can be up to 1Gb in size, with excel files limited to 250mb. Each user also has a storage limit as follows:
- Free users have a maximum 1 GB data capacity.
- Pro users of Power BI Pro have 10 GB maximum capacity.
- Pro users can create groups, with a maximum 10 GB data capacity each.
For more information about the limits themselves and how to view your current usage, there’s PowerBI blog about it here: https://powerbi.microsoft.com/en-us/documentation/powerbi-admin-manage-your-data-storage-in-power-bi/
But what if you’re hitting that 1Gb data limit? There’s very little within PowerBI itself to help you understand which tables are the largest, where you could make some savings, or generally anything about your model itself. The answer is to connect to the model via SSMS and take advantage of the Tabular system views, as described here.
What determines Tabular model size?
It’s worth discussing this briefly before going into the details. Put very simply, the XVelocity engine used by the tabular model will hold more data if there are more unique values for a column column. The key to avoiding large models is, therefore, to avoid columns with huge numbers of lots of distinct values. Text fields will generally be pretty bad for this, although there are common design patterns to avoid the worst offenders.
A simple example is to look at a DateTime column – this combination of date and time means that each minute of each day is a unique value. Even if we ignore seconds, we’re adding 1140 new, distinct records for every day within the system.
If we split this into two fields, a date and a time, this problem goes away. Each new date adds just a single record, whilst we will never have any new hours and minute combinations, so that’s a controllable field.
There are a few techniques to avoid these problems if you find them, I’d advise heading over to Russo & Ferrari for some general tips here and some more detailed techniques here.
Accessing Memory Usage Data
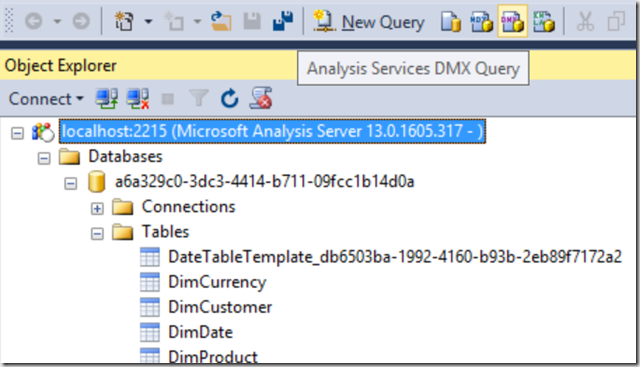
So – following the above instructions, connect to your data model and open a new DMX query:

Here you can use SQL syntax to query several DMVs behind the model – not all of them will be relevant in the cut-down tabular instance that PowerBI uses but there is one in particular that will help us manage our model size – DISCOVER_OBJECT_MEMORY_USAGE.
Admittedly, on it’s own this is pretty incomprehensible. We can filter down the results slightly into something that makes a little sense, but you’ll generally get a big list of model entities with numbers against them – OK as a starter but not great as an actual model optimisation tool:

Stopping here we would at least have a hit-list of the worst-offending columns and we can use this to start tackling our model. But there are much better ways to approach this problem!
Tabular Memory Reports
There are several free tools made available within the SSAS community for people to analyse their current SSAS memory usage. These tools simply query this same data but apply a bit of data modelling and make the data much more accessible.
For straight tabular, I would tend to use Kasper de Jonge’s old excel spread, which pulls in data quite reliably, however there is an updated PowerBI Model found here.
However, this doesn’t play nicely with the PowerBI flavour of tabular just yet, so I would advise using the SQLBI.com Vertipaq Analyser.
Following their instructions and pointing it at my temporary tabular instance, we can refresh successfully and use their categorisations to explore the model. I’ve added some conditional formatting to help see where the issues are.
I can see, for example, which of the tables in my model are the worst offenders, and what’s causing it:

Interestingly the Customer dimension is pretty huge in my example. It has a lot less data than my fact but the dictionaries required are pretty hefty. Dictionaries are built using string lookups and are heavily affected by high volumes of unique values – so I can presume I’ve got some pretty big text strings in this dimension.
Looking at the Column breakdown, I can see where the offenders are:

This tells a slightly different story – my main offenders are from one of the hidden date dimension tables (A sign that relying on PowerBI’s inbuilt date functionality can be a memory drain) and the Sales Order Number – a unique identifier for my fact, obviously this is going to have a large number of distinct values.
The other columns we can do more about – Email address is the next offender. We can assume each customer, of all 18,000 will have a unique email address. However, it’s very rare that we would want to do analysis on the email address specifically, this is a good candidate to remove from the model. At the very least, we could consider keeping only the domain which will yield much fewer unique values.
Hopefully the above will help you move forward in reducing your PowerBI data model size – I’ll be posting about Performance Analysis & Source Control over the next couple of days.
Introduction to Data Wrangler in Microsoft Fabric
What is Data Wrangler? A key selling point of Microsoft Fabric is the Data Science
Jul
Autogen Power BI Model in Tabular Editor
In the realm of business intelligence, Power BI has emerged as a powerful tool for
Jul
Microsoft Healthcare Accelerator for Fabric
Microsoft released the Healthcare Data Solutions in Microsoft Fabric in Q1 2024. It was introduced
Jul
Unlock the Power of Colour: Make Your Power BI Reports Pop
Colour is a powerful visual tool that can enhance the appeal and readability of your
Jul
Python vs. PySpark: Navigating Data Analytics in Databricks – Part 2
Part 2: Exploring Advanced Functionalities in Databricks Welcome back to our Databricks journey! In this
May
GPT-4 with Vision vs Custom Vision in Anomaly Detection
Businesses today are generating data at an unprecedented rate. Automated processing of data is essential
May
Exploring DALL·E Capabilities
What is DALL·E? DALL·E is text-to-image generation system developed by OpenAI using deep learning methodologies.
May
Using Copilot Studio to Develop a HR Policy Bot
The next addition to Microsoft’s generative AI and large language model tools is Microsoft Copilot
Apr