So something which feels like its gone under the radar a bit is the addition of composite models and aggregations in Power BI. These have been around a couple of months now in Preview but I’ve not seen much buzz around the features. After recently attending PASS Summit and seeing Christian Wade’s 1 Trillion row demo, I thought it was worth blogging about – especially as I expect parts of this functionality to be expanded to Azure AS in the near future.
If you think about it, the majority of BI query’s are done at some form of aggregation level but users will still want the detail, and so these features essentially unlock the ability to report against giant datasets at both an aggregated and granular level at the same time – something that was not physically possible beforehand. Power BI is now able to work with multiple petabytes of data with ease over trillions of rows with pretty much instant response times – so this is a bit of a game changer.
Composite Models
Previously with Power BI, you were restricted to either DirectQuery or Import for a single data source. With Composite models that has all changed. A report can now include data connections from more than one connection in any combination, so you are able to connect to both DirectQuery AND Import in the same model and combine the data. This then opens up a world of possibilities that were not possible before. With this functionality, we also have the ability to create many-to-many relationships, but I won’t be doing into detail in this for this blog. As part of this also comes some functionality called Storage Mode which unlocks table-level storage features. This is the next part of the jigsaw.
Storage Mode
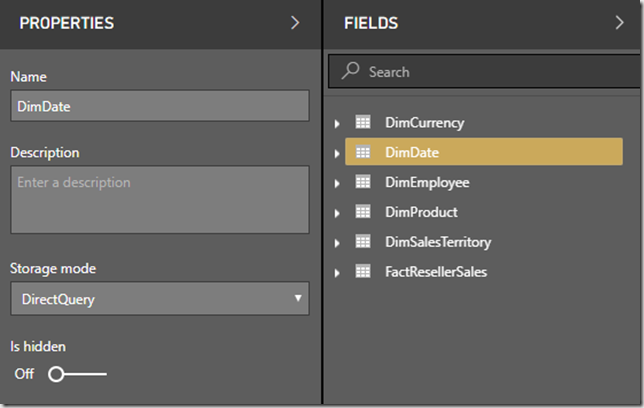
This allows you to specify whether tables are either imported or queried on the fly. There is now a third option “Dual” which acts as either a cached or not cached table depending on the context of the query that’s submitted at runtime.
Setting the correct storage mode has many advantages such as:
- Better query performance (no need to push real time queries to the dataset for relatively static tables such as those used for filters).
- Ability to use larger datasets (interactive analysis is better for datasets you don’t want to cache into memory such as tables with significant data volume).
- Data refresh optimisation (only cache data that’s necessary, meaning quicker refresh times).
- Reducing latency in real-time data (no need to re-read those static tables each time).
To access the storage mode, you either select the table in the report pane and click Properties, or navigate to the table in the new Modelling View (requires exposing this in Options as its in preview).
Changing a table storage mode will then prompt us to change the related tables to Dual. This propagation logic is designed to help with models that contain many tables!

Modelling View
Before I get to aggregations, I also need to introduce the new modelling view. This will be changing to fall in line with what you may be familiar with on SSAS / Azure AS. It feels like this is one of the first steps to integrate SSAS further into the Power BI spectrum and facilitate enterprise datasets. By updating the modelling view, you now have the ability to create additional diagrams, thus allowing you to break out particularly complex models by subject area rather than trying to join it all up within one model. For instance, if you are working with 5 tables in your model, this isn’t a particularly big deal – now multiply that by 10 and all of a sudden it becomes a pain to manage, and this new feature will help alleviate that. The feature also allows you to multi select objects in one go and update properties through a new side-pane. An example of this new feature can be seen below.

Aggregations
Finally, the most exciting feature of the lot – aggregations. Without the new modelling view, without the composite models, without the new storage modes – this would not be possible. Aggregations allow us to create a newly defined table within the model but with all fields of the original table it is created from to be aggregated/grouped in some or another. These aggregations/groups include count, group by, max, min, sum, and count rows. This can be set to either set to Import mode with/without incremental refresh, or via DirectQuery and optimised by using columnstore indexes. This then unlocks faster query performance over huge datasets via the cache at aggregated level using fractions of resource compared to detailed levels.
You then have the flexibility to set the aggregate table to import, while leaving the granular table to DirectQuery, which will speed up performance when navigating the report. The aggregate table can also be hidden so that user will not even be aware of the implementation.
You can also have more than one aggregation table, potentially one for a particular set of reports and then a lower grain aggregate table for analysts, and this can be done through the precedence option. The tool then will then query the aggregation table with highest precedence level first to see if it can resolve the runtime query before moving down the levels.
Aggregations don’t just work for measures such as SUM or COUNT. It also works for more complex measures – all of the components of a measure are always folded down to the sum, min, max, count, level and then those sub query’s work out whether they can hit the cache or not. Its also worth mentioning that you can check if its hit the cache via the DAX editor.

Conclusion
For me, all these features mentioned above will be a bit of a game changer in the right scenario. I’ve ran into scaling problems before and re-working the logic at the Warehouse level for both a granular and aggregated datasets certainly added some overhead. While the functionality obviously doesn’t work with Live Connection into SSAS cubes, this new functionality opens up options for using Power BI to do of the activities which historically would have only been done in SSAS. As Christian Wade also alluded to at PASS, Power BI will soon become a superset of SSAS and so we may well be doing less and less with SSAS and more with Power BI in this area as time goes by.


Heya! I’m at work surfing around your blog from my new iphone 4!
Just wanted to say I love reading your blog and look forward to all your posts!
Keep up the excellent work!