
This is part 3 of my blog series where I will showcase Azure Cognitive Services Integration within Power BI.
In this post, I will focus on Integrating the Anomaly Detector API, which is part of Azure Cognitive Decision service.
The API helps us to overcome the complexity of modelling the real-world data and embed anomaly detection capabilities only in a few steps. It picks up automatically the best machine learning algorithm and applies it to our time series data. The whole data science complexity is hidden behind an HTTP GET request. There is no need to train our model as the service is based on pre-trained AI model that ingests time-series data and selects the best fitting anomaly. Even though the Cognitive Services Anomaly Detector is a pretty new API, it is based on multiple trained models. This ensures highest possible accuracy and relevant ML model choice.
Why do we need Anomaly Detection service?
Anomaly detection is about identifying outliers in a time series data using mathematical models, correlating influencing factors and delivering insights to business decision makers. Using anomaly algorithms across multiple values and automatically correlating them offers multiple benefits for businesses in multiple industries. In today’s fast-moving business an autonomous anomaly detection on time equals money. When an anomaly, or unexpected data pattern, occurs, each second can amount to additional loss or missed opportunities. The most frequent reasons for your business to leverage Anomaly detection solution can be summarized as follows:
- To foresee problems before they occur – by monitoring on a regular basis website visitors, KPIs, revenue. To know on time when there is a sudden change like a big loss, visitors increase, e.g.
- In IoT – for prevention of temperature spike, humidity of a machine, etc.
- To detect seasonality, trend changes, patterns
Loading the data in Power BI & Preparing it for analysis
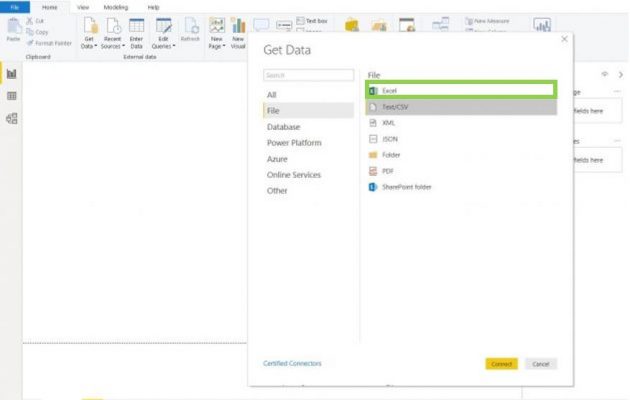
To get started, open your Power BI Desktop application and load your time series data.
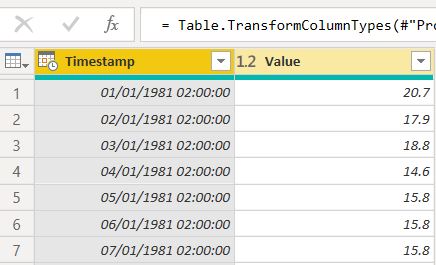
For this demo I will use an uni-variate time series temperature data set in a .xlsx format. The following snippet shows how our data looks like.
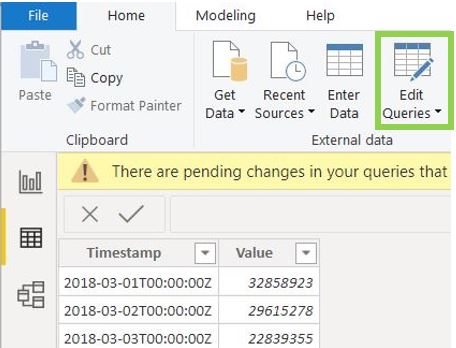
As next step, we need to make sure our columns are in the right data type for applying data. We do that by opening the Query Editor menu.
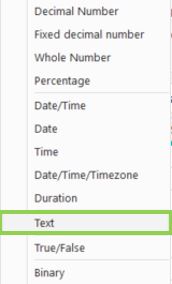
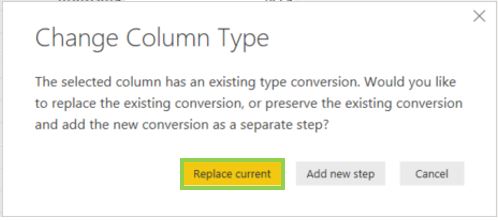
In the Query editor we are able to see the data type for each column. For the purpose of this demo it is important to change the data type of the “Timestamp” column to Text and click on ”Replace current”.

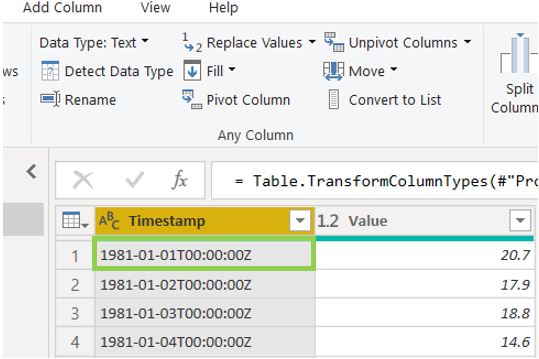
This is how our data looks like after changing the data types accordingly. It is highly important your date column to be exactly in the format ” yyyy-mm-ddT00:00:00.00Z”‘ and Text Data type.
You should rename your date column to “Timestamp” and your value column (which contains sales amount, quantity, temperature, etc.) to “Value” for the API to work properly.
Setting up a Cognitive Services resource
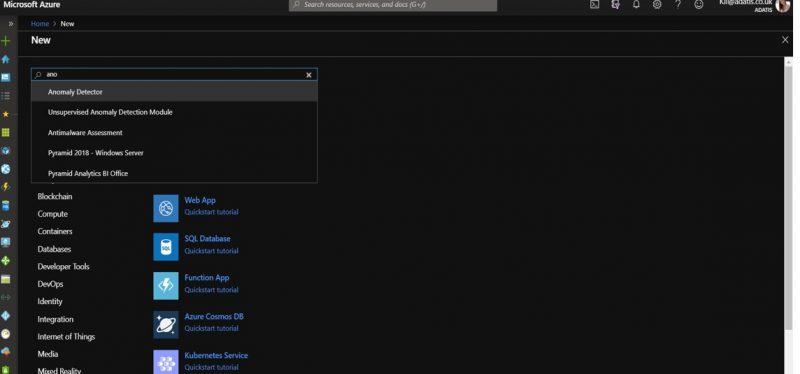
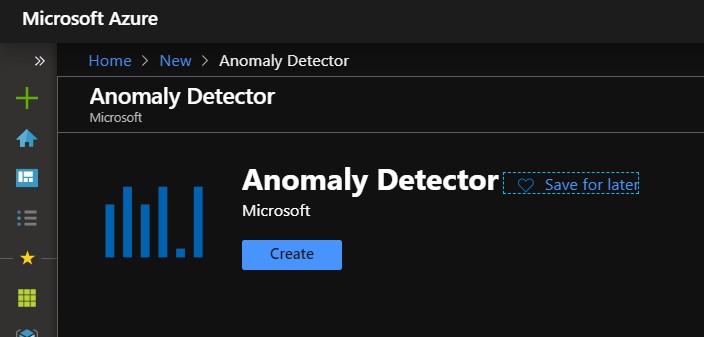
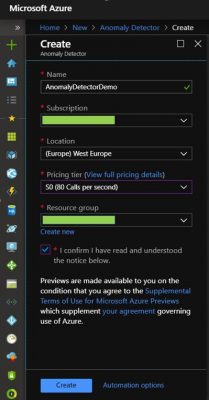
First we need to create Anomaly detector resource from the Azure Portal. To add such resource, navigate to “ + Create a resource ” and type “Anomaly Detector” in the search resources bar and hit “Create”.
Give a Name, Subscription, Location and Resource to your API as shown on the screenshot below.
If you use the service for the first time, you have the option for a $0 Pricing tier. It allows us 80 calls per second for development and testing purposes.
For further pricing details, visit the official Microsoft Web page: https://azure.microsoft.com/is-is/pricing/details/cognitive-services/anomaly-detector/
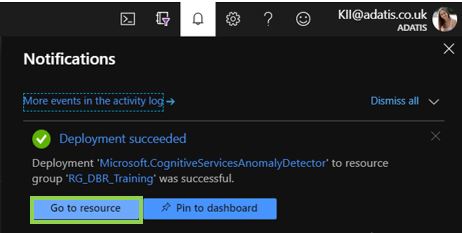
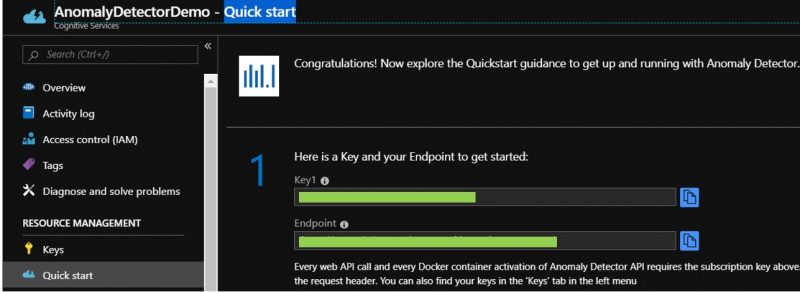
After our Anomaly Detector resource is deployed, go into its “Quick start” menu in the Resource Management section and take your unique API key and Endpoint. You will need them for calling the Anomaly Detector API from Power BI later.
Applying Anomaly Detection in Power BI
Now we have our data loaded in Power BI Desktop and our Cognitive Services resource. Next, we need to connect the Anomaly Detector with Power BI by writing a custom Power BI function.
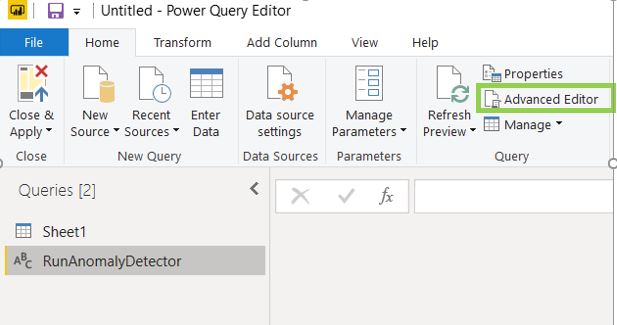
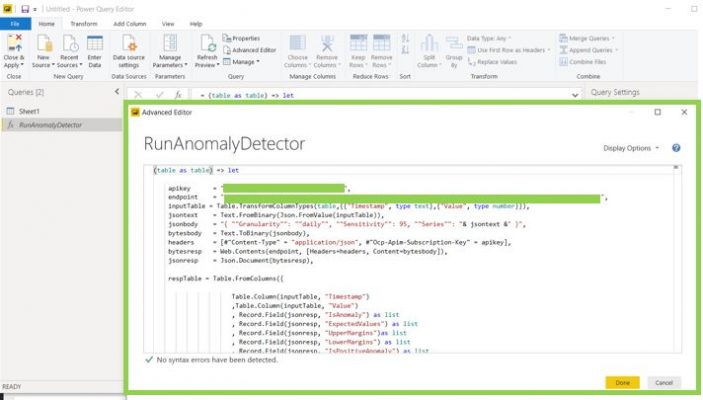
In the Query section of the Power BI Editor window, right click and select New Query, then Blank query. You should see such blank field where we will insert a script. I will rename my custom function adequately to the action it performs – “RunAnomalyDetector”. From the Home tab, click on “Advanced Editor” – here you will write your custom function.
I took the script from Microsoft’s official documentation and changed the assigned API key and endpoint which the ones we just created above.
(table as table) => let

    apikey      = "[Placeholder: Your Anomaly Detector resource access key]",
    endpoint    = "[Placeholder: Your Anomaly Detector resource endpoint]/anomalydetector/v1.0/timeseries/entire/detect",
    inputTable = Table.TransformColumnTypes(table,{{"Timestamp", type text},{"Value", type number}}),
    jsontext    = Text.FromBinary(Json.FromValue(inputTable)),
    jsonbody    = "{ ""Granularity"": ""daily"", ""Sensitivity"": 95, ""Series"": "& jsontext &" }",
    bytesbody   = Text.ToBinary(jsonbody),
    headers     = [#"Content-Type" = "application/json", #"Ocp-Apim-Subscription-Key" = apikey],
    bytesresp   = Web.Contents(endpoint, [Headers=headers, Content=bytesbody]),
    jsonresp    = Json.Document(bytesresp),

    respTable = Table.FromColumns({

                     Table.Column(inputTable, "Timestamp")
                     ,Table.Column(inputTable, "Value")
                     , Record.Field(jsonresp, "IsAnomaly") as list
                     , Record.Field(jsonresp, "ExpectedValues") as list
                     , Record.Field(jsonresp, "UpperMargins")as list
                     , Record.Field(jsonresp, "LowerMargins") as list
                     , Record.Field(jsonresp, "IsPositiveAnomaly") as list
                     , Record.Field(jsonresp, "IsNegativeAnomaly") as list

                  }, {"Timestamp", "Value", "IsAnomaly", "ExpectedValues", "UpperMargin", "LowerMargin", "IsPositiveAnomaly", "IsNegativeAnomaly"}
               ),

    respTable1 = Table.AddColumn(respTable , "UpperMargins", (row) => row[ExpectedValues] + row[UpperMargin]),
    respTable2 = Table.AddColumn(respTable1 , "LowerMargins", (row) => row[ExpectedValues] -  row[LowerMargin]),
    respTable3 = Table.RemoveColumns(respTable2, "UpperMargin"),
    respTable4 = Table.RemoveColumns(respTable3, "LowerMargin"),

    results = Table.TransformColumnTypes(

                respTable4,
                {{"Timestamp", type datetime}, {"Value", type number}, {"IsAnomaly", type logical}, {"IsPositiveAnomaly", type logical}, {"IsNegativeAnomaly", type logical},
                 {"ExpectedValues", type number}, {"UpperMargins", type number}, {"LowerMargins", type number}}
              )

 in results
The script is accepting a table parameter with two columns, converting it into a JSON format, sending it to Cognitive services by using API key and Endpoint and converting the returned JSON values back into a table format with added columns “‘IsAnomaly”, “IsPositiveAnomaly”, “IsNegativeAnomaly”, “ExpectedValues”, “UpperMargins”, “LowerMargins”.
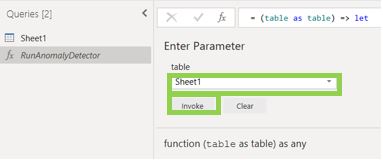
Then we invoke the function from the Power Query Editor window/ Add column/ Invoke custom function. Then we select out data set – “Sheet1” and hit “Invoke”.
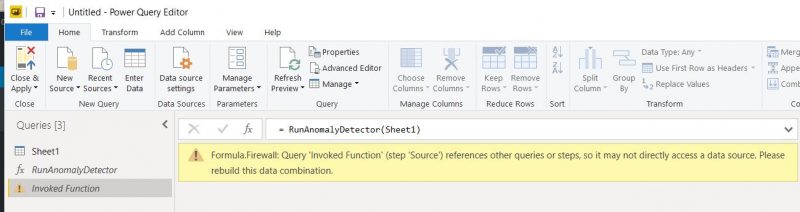
It is possible to receive a Firewall error message. You can resolve that from the Privacy settings of your current .pbix file by changing them to “Ignore the privacy levels and potentially improve performance”.
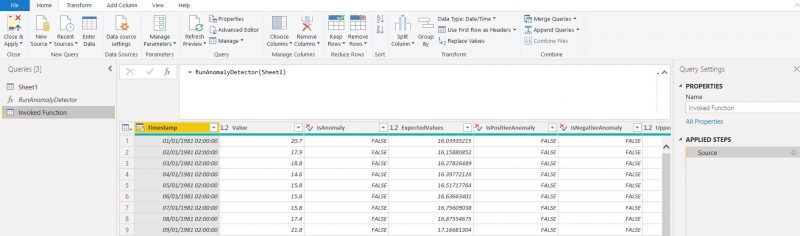
After that the function should run smoothly. After its execution a new “Invoked Function” table is created. It contains a valuable input data for our Anomaly Detection Analysis.
Anomaly Detection Visualization
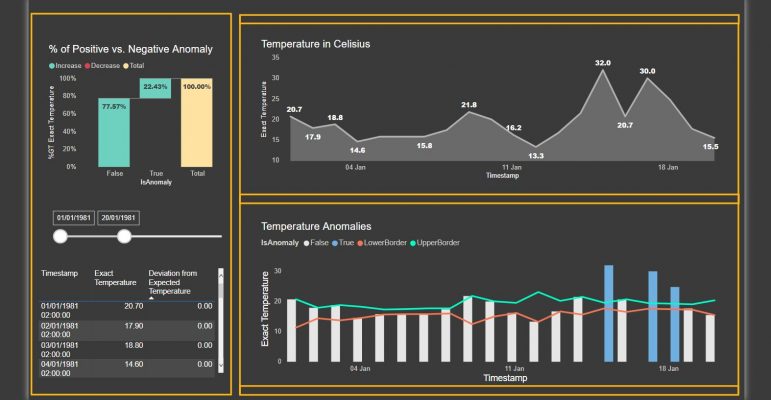
As a final step I will create a sample Data Anomaly visualization in Power BI Desktop. There are only positive anomalies in the current data set, almost 23% in total, colored in blue. We can obtain the exact temperature variance form its expected value from the report as well.
Hope you enjoyed my post and found it useful.
If you would like to know how we could help you with your data, please get in touch.
Introduction to Data Wrangler in Microsoft Fabric
What is Data Wrangler? A key selling point of Microsoft Fabric is the Data Science
Jul
Autogen Power BI Model in Tabular Editor
In the realm of business intelligence, Power BI has emerged as a powerful tool for
Jul
Microsoft Healthcare Accelerator for Fabric
Microsoft released the Healthcare Data Solutions in Microsoft Fabric in Q1 2024. It was introduced
Jul
Unlock the Power of Colour: Make Your Power BI Reports Pop
Colour is a powerful visual tool that can enhance the appeal and readability of your
Jul
Python vs. PySpark: Navigating Data Analytics in Databricks – Part 2
Part 2: Exploring Advanced Functionalities in Databricks Welcome back to our Databricks journey! In this
May
GPT-4 with Vision vs Custom Vision in Anomaly Detection
Businesses today are generating data at an unprecedented rate. Automated processing of data is essential
May
Exploring DALL·E Capabilities
What is DALL·E? DALL·E is text-to-image generation system developed by OpenAI using deep learning methodologies.
May
Using Copilot Studio to Develop a HR Policy Bot
The next addition to Microsoft’s generative AI and large language model tools is Microsoft Copilot
Apr