Let me start this blog with two questions. 1) How can Joanna, from the HR department, query the mentor/mentee structure from the organisation? 2) How can Robin, from the resourcing department, find the most suitable and available consultant to start a new project next week? I’m sure at this point you are thinking that to solve both problems they could simply query the HR and the Resource Planning systems, and you are right, but, what if they could get the answer for both questions from a single system? In this blog I’ll demonstrate how to achieve such requirement using Azure Cosmos DB Graph (Gremlin).
Graph Theory
In graph theory, a graph is an ordered pair comprising a set of vertices and edges. A vertex is the fundamental unit of which graphs are formed and are usually represented by a circle with a label. An edge is represented by a line or arrow extending from one vertex to another.
Graphs can be used to model many types of relations and processes in many different areas. For example, we can represent the link structure of a website as a graph, the web pages as vertices and the links from one page to another as edges.
Azure Cosmos DB
Azure Cosmos DB is a globally distributed multi-model database with the capacity to store various types of data, such as document, relational, graph and key values. It provides all the necessary tools to elastically scale throughput and storage across any number of Azure’s geographic regions (further details here).
Azure Cosmos DB supports a variety of popular API’s to access and query the data, such as SQL, MongoDB, Cassandra, Graph (Gremlin) and Table API. In this instance, I will focus on the Graph (Gremlin) API.
Gremlin
Gremlin is the graph traversal language of Apache TinkerPop, an open source Graph Computing Framework. Gremlin allows the users to write complex queries to traverse their graphs by using a composed sequence of steps, with each step performing an operation on the data stream (further details here). There are 4 fundamental steps:
- transform: transform the objects in the stream
- filter: remove objects from the stream
- sideEffect: pass the object, but yield some side effect
- branch: decide which step to take
Scenario
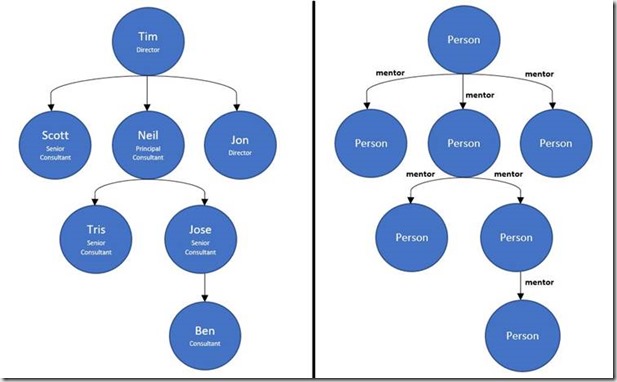
The image in the left is an example of the mentor/mentee structure. If we convert it to a graph (image in the right), we have the people represented as vertices and the relationship mentor as edges.

Now, let’s create the database and the graph. When creating the Azure Cosmos DB, we need to ensure we select the Gremlin (graph) API.


To populate and query our graph, we have three options, the Azure Portal, the Gremlin Console or the Guided Gremlin Tour. The last two tools can be downloaded from the Quick Start section once we create the sample container or directly downloaded here and here.

In the Azure Portal, CRUD operations can be performed via the Data Explorer UI and Gremlin queries. The results can be visualised in a Graph or in GraphJSON format, the Gremlin standard format to represent vertices, edges and properties using JSON.
In the proposed scenario, we will create 7 vertices and 6 edges. The vertices will be labelled as person and will have 3 properties, First Name, Position and In Bench (indicates if a consultant is allocated to a project or not). The edges, labelled as mentor, will define the relation between consultants.
Create a vertex
g.addV('person').property('firstName', 'Tim').property('position', 'Director') .property('inBench', '1')

Create an edge
g.V().hasLabel('person').has('firstName', 'Tim').addE('mentor').to(g.V().hasLabel('person').has('firstName', 'Neil'))
Below is how the graph looks like when all vertices and edges are created.

Joanna has now all that is needed to obtain valuable information. For example, she can traverse the graph and obtain the list of Principal and Senior Consultants that are mentored by Tim.
g.V().hasLabel('person').has('firstName', 'Tim').outE('mentor').inV().hasLabel('person').has('position', within('Principal Consultant','Senior Consultant'))
.group().by('firstName').by(values('position'))
[
{
"Neil": "Principal Consultant",
"Scott": "Senior Consultant"
}
]
To support Robin, we will add two new instances of vertices, Blog and Project. The Blog vertex will be related with the Person vertex and will indicate who wrote blogs and which technology was covered. The Project vertex will be related with the Person vertex and will indicate who worked in a certain project. The Project vertex will have the client, the name of the project, the duration and which technology was used as properties.

If Robin needs to find a consultant with experience in Azure Cosmos DB, he can query the graph and verify who either wrote a blog or worked in a previous project with that technology. On top of that, he can filter the results by indicating he is only interested in consultants that are currently in the bench.
g.V().hasLabel('person').where(outE('worked').or().outE('wrote').has('tech', 'Azure CosmosDB')).has('inBench', '1')

Conclusions
Hopefully, using a very simple scenario, I managed to demonstrate the potential of Azure Cosmos DB Graph to build complex queries, implement powerful graph traversal logic and help the business to quickly obtain insights from very complex models..
As always, if you have any questions or comments do let me know.
Introduction to Data Wrangler in Microsoft Fabric
What is Data Wrangler? A key selling point of Microsoft Fabric is the Data Science
Jul
Autogen Power BI Model in Tabular Editor
In the realm of business intelligence, Power BI has emerged as a powerful tool for
Jul
Microsoft Healthcare Accelerator for Fabric
Microsoft released the Healthcare Data Solutions in Microsoft Fabric in Q1 2024. It was introduced
Jul
Unlock the Power of Colour: Make Your Power BI Reports Pop
Colour is a powerful visual tool that can enhance the appeal and readability of your
Jul
Python vs. PySpark: Navigating Data Analytics in Databricks – Part 2
Part 2: Exploring Advanced Functionalities in Databricks Welcome back to our Databricks journey! In this
May
GPT-4 with Vision vs Custom Vision in Anomaly Detection
Businesses today are generating data at an unprecedented rate. Automated processing of data is essential
May
Exploring DALL·E Capabilities
What is DALL·E? DALL·E is text-to-image generation system developed by OpenAI using deep learning methodologies.
May
Using Copilot Studio to Develop a HR Policy Bot
The next addition to Microsoft’s generative AI and large language model tools is Microsoft Copilot
Apr