
The first blog ‘Part 1 – Introduction to Geospatial data’ gave an overview into geospatial data analysis and its increasing importance in big data analytics. This blog will outline an architecture sample solution to manage the ingestion of geospatial datasets, analytical processing, and display of geospatial data. A high-level overview will be given.
Many companies and organisations have challenges in dealing with geospatial data at scale. The massive proliferation in geospatial data coupled with technical requirements have overwhelmed traditional storage and processing systems. Pressures due to data volume, storage costs, and redundant databases processing has led to organisations underutilising Geospatial analytics. Additionally, few have the experience in the technology architecture to prepare complex geospatial datasets for analytics.
The architecture diagram below illustrates an architecture solution for managing large volumes of geospatial data:
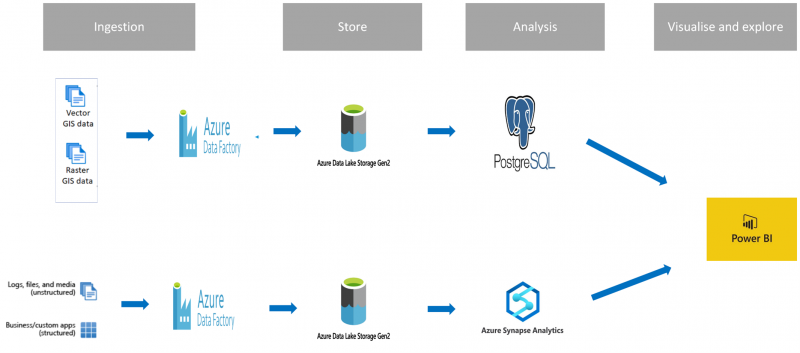
It is rare in modern data Warehouse analytics for the end user to only utilise geospatial data or analytical business data on its own. Both types of data when combined can provide powerful insights and delivery meaningful conclusions. The architecture diagram illustrates both geospatial and analytical data processes to form a Composite model in Power BI.
Raw geospatial data can be in various formats such as Vector or Raster. Both the geospatial and analytical data will be ingested via Azure Data Factory (ADF) which is an orchestration service.
Once ingested the geospatial data is stored in Data Lake Storage and copied into Azure PostgreSQL. PostgreSQL is a Paas database solution similar to Azure SQL DB. PostGIS is an extension to PostgreSQL that supports many spatial functions and spatial data types. Since PostGIS is a spatial database, it contains a geometry column with the data being in a specific format called spatial reference identifier (SRID). This reference system identifies geometric types such as coordinate systems. Analytical data types can be analysed using Azure Synapse Analytics which combines big data analytics, data warehousing and data integration into a comprehensive unified service.
Once transformation and analysis of the data has been carried out, the data can be visualised using tools such as PowerBI via ArcGIS and geospatial functionalities. Alternatively, Azure maps can be used to provide geographic context and location intelligence. Data Explorer can be a used to provide insightful visualisations. Azure Data Explorer utilises geospatial functionalities such as creating scatterplots from geospatial data.
One alternative to PostgreSQL is Azure Cosmos DB, which is a non-relational database. Cosmos DB can be used to support indexing and querying of spatial data represented by the GeoJSON specification. The benefit of this is that GeoJSON data structures do not require specialised tools or libraries. Data that is queried in Cosmos DB can be brought into Synapse for data enrichment and big data analytics.
Part 3 of the blog series will give a more detailed and in-depth explanation of the technical solutions to process and analyse geospatial data. To make sure you don’t miss part 3, follow us on LinkedIn!
Introduction to Data Wrangler in Microsoft Fabric
What is Data Wrangler? A key selling point of Microsoft Fabric is the Data Science
Jul
Autogen Power BI Model in Tabular Editor
In the realm of business intelligence, Power BI has emerged as a powerful tool for
Jul
Microsoft Healthcare Accelerator for Fabric
Microsoft released the Healthcare Data Solutions in Microsoft Fabric in Q1 2024. It was introduced
Jul
Unlock the Power of Colour: Make Your Power BI Reports Pop
Colour is a powerful visual tool that can enhance the appeal and readability of your
Jul
Python vs. PySpark: Navigating Data Analytics in Databricks – Part 2
Part 2: Exploring Advanced Functionalities in Databricks Welcome back to our Databricks journey! In this
May
GPT-4 with Vision vs Custom Vision in Anomaly Detection
Businesses today are generating data at an unprecedented rate. Automated processing of data is essential
May
Exploring DALL·E Capabilities
What is DALL·E? DALL·E is text-to-image generation system developed by OpenAI using deep learning methodologies.
May
Using Copilot Studio to Develop a HR Policy Bot
The next addition to Microsoft’s generative AI and large language model tools is Microsoft Copilot
Apr