Microsoft’s January 2018 Power BI Desktop update (blog found here) contains quite a few small visualisation features, but the one that stood out most to me is the ability to import PowerApps as a Custom Visual. My last two blogs (Part 1 and Part 2) demonstrated how to embed a PowerApp into a Power BI Dashboard in the service, but it wasn’t possible to achieve this in Power BI Desktop or a Report. How things have changed within a month!
This article illustrates how quick and easy it now is to plug an existing PowerApp into Power BI Desktop.
PowerApps Custom Visual
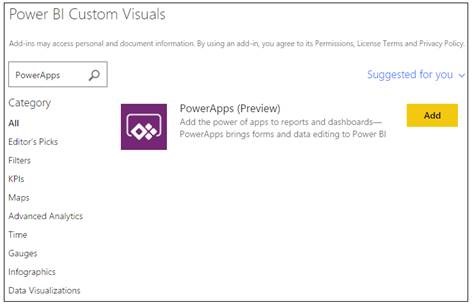
Like all popular Custom Visuals, you can either Import from file (stored on a local machine) or Import from store. The Microsoft endorsed Custom Visuals are found in the store, which is why I would generally advise importing visuals from there. Search for “PowerApps” and it will appear as the top result.
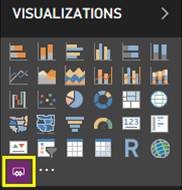
Click ‘Add’ and the PowerApps Custom Visual is available.
NOTE: The PowerApps Custom Visual is currently in Preview, meaning its reliability cannot be 100% guaranteed. Always use Preview tools/features/visuals with caution.
PowerApp Connection
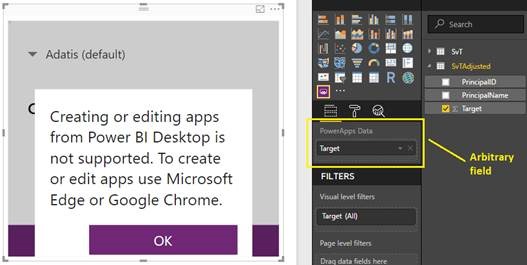
I previously created an ‘SvT Adfjusted’ PowerApp, which will be used for this example. Firstly, the visual needs to have ‘data’. It can be an attribute or measure, but doesn’t matter when connecting to an existing PowerApp. If you haven’t logged into the PowerApps portal, you may be promoted to do so with Power BI Desktop. Once logged in, you will see the below screen:
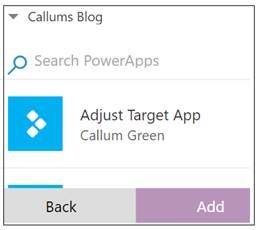
If you see the ‘not supported’ error message above, do not worry – this is red herring. Click ‘OK’ and then navigate to the appropriate Environment within the nested PowerApps portal. ‘Adjust Target App’ resides in the ‘Callums Blog’ Environment.
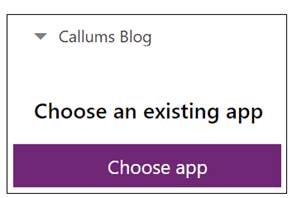
Click ‘Choose App’, select the PowerApp and click ‘Add’.
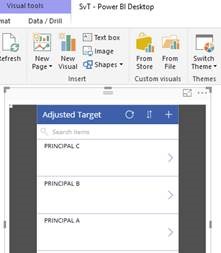
That’s it, the PowerApp is now embedded and ready to use in Power BI Desktop.
It is also possible to create a new PowerApp within Power BI Desktop, which is demonstrated in this video. The look, feel and general experience is the same as what you see in the PowerApps portal, meaning you do not even need to use a web browser to get started.
PowerApps Refresh
I wander how long Power BI Desktop takes to refresh when a change is made to the embedded PowerApp? Let’s find out.
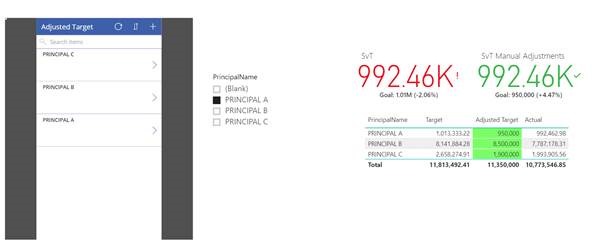
Before:
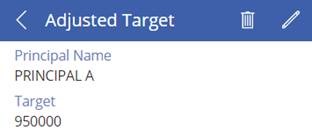
Principal A ‘Target’ value is changed from 850000 to 950000.
Unfortunately, nothing happens. Power BI Desktop caches the data sourced from the Azure SQL Database, which is where the PowerApp data is stored. The only ways to view the change is to click the Power BI ‘Refresh’ button or change the context of the visual interaction within a report. What I mean by the latter is that you need to force the Tabular engine to write a new DAX query, which in turn, forces a query refresh. Using the ‘Refresh’ button (below) will always be the simplest refresh method.
After:
Published Report
The report can now be published to the Power BI Service.
The Service contains the same refresh issues as described in Power BI Desktop. Manually refreshing the web page (CTRL-F5) is currently the best approach. It is worth noting there is between 15-30 seconds delay between a submitting a PowerApp change and viewing the new number in a visual. This is expected, as there are a few processes (behind the scenes) that must happen first.
Web Content vs. Custom Visual
There are now two ways of adding a PowerApp into the Power BI Service – but which is better?
Web Content
– Advantages
o Easy to dynamically add a ‘Web Content’ tile to a Dashboard.
o More flexibility around the link behavior e.g. open custom link or other report in a new tab.
o The PowerApp sits completely outside of Power BI and does not necessarily need to be seen in a report.
– Disadvantages
o PowerApp embed code is required and may not be available to all users.
o Extra layer of management and maintenance.
Custom Visual
– Advantages
o No increase in the Power BI Desktop data model or file size. The PowerApp is sourced from the cloud and acts as a Live Connection.
o One stop shop where both visuals and the PowerApp reside.
o Less places for an issue to occur. Security can also be resolved, using Power BI Desktop as a test.
o PowerApp can be pinned as a visual – to an existing or new Dashboard. This step is far more user friendly and easier to achieve with the Custom Visual.
– Disadvantages
o No ability to use custom links.
Whilst Web Content does offer a bit more flexibility and interactivity, I would advise using the Custom Visual wherever possible. Having one place where everything is managed, makes everyone’s lives far easier. If you have a good business case for adopting Web Content, then of course, please do so.
References
Find other recommended resources below.
o PowerApps Custom Visual Video – http://bit.ly/2Fi3vLY
o Power BI January Update – http://bit.ly/2CSfLVl
o PowerApps – http://bit.ly/2Brjys4
o Flow – http://bit.ly/2CoL2vW
o Common Data Service – http://bit.ly/2CnXXhv
Contact Me
If you have any questions or want to share your experiences with the PowerApps Custom Visual, feel free to leave a comment below.
Twitter: @DataVizWhizz




Introduction to Data Wrangler in Microsoft Fabric
What is Data Wrangler? A key selling point of Microsoft Fabric is the Data Science
Jul
Autogen Power BI Model in Tabular Editor
In the realm of business intelligence, Power BI has emerged as a powerful tool for
Jul
Microsoft Healthcare Accelerator for Fabric
Microsoft released the Healthcare Data Solutions in Microsoft Fabric in Q1 2024. It was introduced
Jul
Unlock the Power of Colour: Make Your Power BI Reports Pop
Colour is a powerful visual tool that can enhance the appeal and readability of your
Jul
Python vs. PySpark: Navigating Data Analytics in Databricks – Part 2
Part 2: Exploring Advanced Functionalities in Databricks Welcome back to our Databricks journey! In this
May
GPT-4 with Vision vs Custom Vision in Anomaly Detection
Businesses today are generating data at an unprecedented rate. Automated processing of data is essential
May
Exploring DALL·E Capabilities
What is DALL·E? DALL·E is text-to-image generation system developed by OpenAI using deep learning methodologies.
May
Using Copilot Studio to Develop a HR Policy Bot
The next addition to Microsoft’s generative AI and large language model tools is Microsoft Copilot
Apr