I think I’ve found a bug in the way the Excel Add-In generates MDX under certain ‘rolling’ conditions. The requirement I have is to be able to forecast at the day level for a rolling 6 months; starting from the current period (which is to be updated each week) running for a period of 180 days (~ 6 months)
To prevent requiring 180 columns, a dimension property based filter must be available to select the month in which to forecast. This will provide a more concise data entry form detailing up to 31 days of the selected month in which to add forecast values.
My form is dimensioned up as follows:
| Dimension | Position |
| Employee | Filter |
| Time(Month) | Filter (Dimension Property) |
| Scenario | Filter |
| Location | Rows |
| Time (Day) | Columns |
I set up the columns as a dynamic range to ensure that the forecast ‘rolls’ with changes in current period. The range was set from current member id + 0 : current member id + 180. [Current Period is set to 16th September 2008 – today).
The simplified MDX that this produces is below:
select
    {

        Ancestor([Time].[Base View].[MemberId].&[20080916], [Time].[Base View].[MemberId]).Lag(0)
        :
        Ancestor([Time].[Base View].[MemberId].&[20080916], [Time].[Base View].[MemberId]).Lag(-180)
    }
    *
    {
        [Measures].[Value]
    } on columns,

    {
        descendants([Location].[Standard].[All].[All Locations],,after)
    } on rows
from
(
    select
        {[Time].[Month].[All].[September 2008]} on columns from [LocationPlan])
where

    {[Employee].[Employee].[All].[John Doe]}
    *
    {[Scenario].[All Members].[All].[Forecast]}
The first element to notice is that the columns have been set to a range using ancestor at the member id level and lag to cover the 180 days:
Ancestor([Time].[Base View].[MemberId].&[20080916], [Time].[Base View].[MemberId]).Lag(0)
:
Ancestor([Time].[Base View].[MemberId].&[20080916], [Time].[Base View].[MemberId]).Lag(-180)
The next point to highlight is the sub=query that represents the selected time dimension property value (September 2008):
{[Time].[Month].[All].[September 2008]} on columns from [LocationPlan])
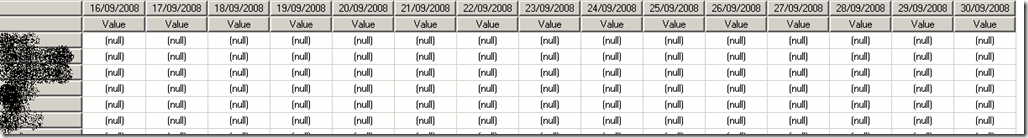
When you run this in SSMS, the following data set is returned:
The Locations appear on the rows, the days appear on the columns – exactly as required.
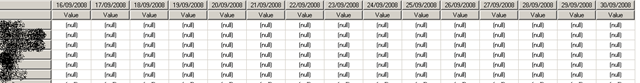
By changing the sub-query filter to October 2008 – the next month in the range, and definitely covered by the -180 day lag (Not sure why the Lead function isn’t used here?) – results in a problem, the results returned now are missing the day level columns:

The root of this problem is the column expression – if you replace the column expression with a direct lag on the current period member the expected results are returned:
select
    {

        [Time].[Base View].[MemberId].&[20080916].Lag(0)
        :
        [Time].[Base View].[MemberId].&[20080916].Lag(-180)
    }
    *
    {
        [Measures].[Value]
    } on columns,

    {
        descendants([Location].[Standard].[All].[All Locations],,after)
    } on rows
from
(
    select
        {[Time].[Month].[All].[September 2008]} on columns from [LocationPlan])
where

    {[Employee].[Employee].[All].[John Doe]}
    *
    {[Scenario].[All Members].[All].[Forecast]}

Now, the only workaround I can come up with is to build the form using a custom MDX formula so I reckon this warrants raising a bug on connect – which I’ve logged here:
https://connect.microsoft.com/feedback/ViewFeedback.aspx?FeedbackID=368206&SiteID=181
Introduction to Data Wrangler in Microsoft Fabric
What is Data Wrangler? A key selling point of Microsoft Fabric is the Data Science
Jul
Autogen Power BI Model in Tabular Editor
In the realm of business intelligence, Power BI has emerged as a powerful tool for
Jul
Microsoft Healthcare Accelerator for Fabric
Microsoft released the Healthcare Data Solutions in Microsoft Fabric in Q1 2024. It was introduced
Jul
Unlock the Power of Colour: Make Your Power BI Reports Pop
Colour is a powerful visual tool that can enhance the appeal and readability of your
Jul
Python vs. PySpark: Navigating Data Analytics in Databricks – Part 2
Part 2: Exploring Advanced Functionalities in Databricks Welcome back to our Databricks journey! In this
May
GPT-4 with Vision vs Custom Vision in Anomaly Detection
Businesses today are generating data at an unprecedented rate. Automated processing of data is essential
May
Exploring DALL·E Capabilities
What is DALL·E? DALL·E is text-to-image generation system developed by OpenAI using deep learning methodologies.
May
Using Copilot Studio to Develop a HR Policy Bot
The next addition to Microsoft’s generative AI and large language model tools is Microsoft Copilot
Apr