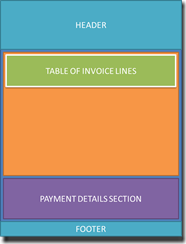
A client recently asked for an invoice document to be designed using SSRS. The layout was pretty standard but for one important caveat: The payment details section had to be in a fixed position at the bottom of the last page of the report, so a 3-page invoice should look like this example:
This could be achieved by putting the ‘Payment Details Section’ fields in the report footer, and setting their visibility based on the report page number. Unfortunately in SSRS there is only one footer for every page and it’s height cannot be varied between pages. The client did not want to waste space in the report body, which is a side-effect of this method.
So, how to fix the position of a report element to the bottom of the report?
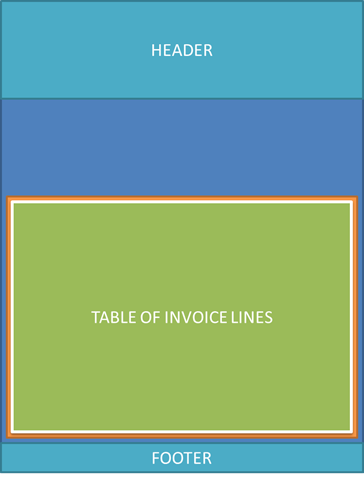
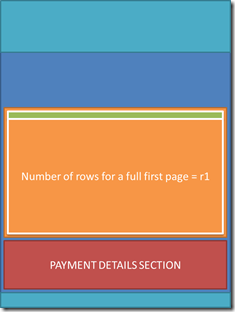
The basic premise of my solution was to incorporate a ‘hidden’ element into the report body. This element can grow or shrink dynamically to alter the distance between the last of the invoice lines and the payment details section, and thus appears to keep the payment details ‘fixed’ at the bottom of the report. To do this, we need to know how many rows of data can fit on the first page of the report (r1):
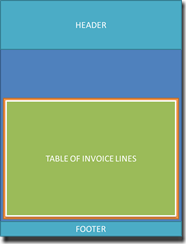
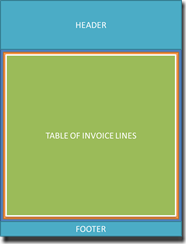
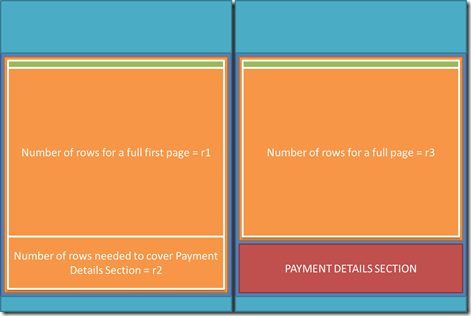
And how many we need to add to push the payment details section to the bottom of the next page (r2 + r3):
Once we have values for r1, r2 and r3, we need to add (r2+r3) additional rows to the invoice lines table on our layout. These rows must be outside of all groupings on the table as we don’t want them repeated with the groups, we just want them to appear at the foot of the table. To get the desired effect, we need to control the visibility on these additional rows such that given the total number of data rows in the table, enough additional rows are visible to ‘push’ the payment details section to the bottom of the last page.
To control the visibility of the additional rows, we need to add some code to the report:
1: Public Function RowHidden(countRows As Integer, thisRow As Integer) As Boolean
2:
3: Dim maxRowsPageOne, additionalRows As Integer
4: Const TOTALADDITIONALROWS As Integer = 35
5: maxRowsPageOne = 12
6:
7: If (countRows <= maxRowsPageOne) Then
8: If (thisRow <= (maxRowsPageOne - countRows)) Then 'Current row is inside visible range for first page
9: Return False 'Show the row
10: Else
11: Return True 'Hide the row
12: End If
13: Else
14: additionalRows = TOTALADDITIONALROWS - ((countRows - maxRowsPageOne) Mod TOTALADDITIONALROWS) 'This is key, determines count of rows to make visible
15: If additionalRows < TOTALADDITIONALROWS Then
16: If thisRow <= additionalRows Then
17: Return False 'Show the row
18: Else
19: Return True 'Hide the row
20: End If
21: Else
22: Return True 'Hide all extra columns
23: End If
24: End If
25:
26: End Function
This code needs to be called by every additional row in the invoice lines table using =Code.RowHidden(CountRows(), 1) where ‘1’ represents the number of the particular row, starting from the first additional row after the data rows.
And that’s all there is to it! It should be noted that this method means the cells in the invoice line table cannot be allowed to grow, or the calculations for the number of additional rows to show will not work. You also need to be very careful with any future changes to the layout of the report, as these could also affect those calculations. It’s certainly worth seeing if there can be some compromise on the positioning of report elements to something that SSRS can handle better, but if not, then I hope this is useful!
Until next time…..

Introduction to Data Wrangler in Microsoft Fabric
What is Data Wrangler? A key selling point of Microsoft Fabric is the Data Science
Jul
Autogen Power BI Model in Tabular Editor
In the realm of business intelligence, Power BI has emerged as a powerful tool for
Jul
Microsoft Healthcare Accelerator for Fabric
Microsoft released the Healthcare Data Solutions in Microsoft Fabric in Q1 2024. It was introduced
Jul
Unlock the Power of Colour: Make Your Power BI Reports Pop
Colour is a powerful visual tool that can enhance the appeal and readability of your
Jul
Python vs. PySpark: Navigating Data Analytics in Databricks – Part 2
Part 2: Exploring Advanced Functionalities in Databricks Welcome back to our Databricks journey! In this
May
GPT-4 with Vision vs Custom Vision in Anomaly Detection
Businesses today are generating data at an unprecedented rate. Automated processing of data is essential
May
Exploring DALL·E Capabilities
What is DALL·E? DALL·E is text-to-image generation system developed by OpenAI using deep learning methodologies.
May
Using Copilot Studio to Develop a HR Policy Bot
The next addition to Microsoft’s generative AI and large language model tools is Microsoft Copilot
Apr