There’s lot of info out there about setting up the application pool identity so that you can set up data sources for dashboards (For example). However there seems to be very little about the various roles that are used in the Dashboard Designer and how to set them up.
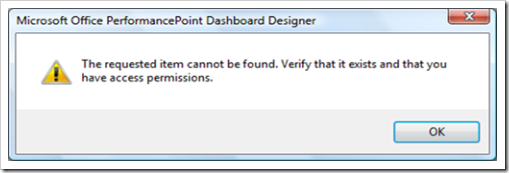
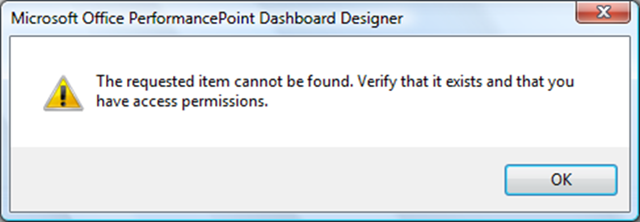
If you try and connect to the Dashboard designer without appropriate access it will let you open the application and try and create data sources etc but you’ll just get an error message like the one below when you try and connect to a server.
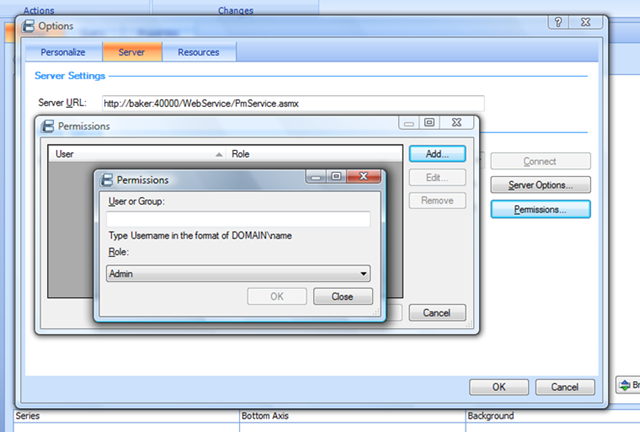
Granting Permissions is a bit hidden away if you don’t know where to look and you need to be logged as an existing monitoring server administrator to do this:
- Click on the office icon top left and then the Options button.
- On the Server tab of the new window that pops up you’ll see a Connect button.
- Enter the server name e.g. http://servername:40000/WebService/PmService.asmx
- Click the Connect button – if you’re not an existing Monitoring Server admin (or a local admin on the monitoring box) you’ll get an error message here
- If all is well the Server Options and Permissions buttons will get enabled
- Click Permissions and then Add on the next window and you’ll see the window at the centre of the image below.
- Enter the user name and select the role you want to put that user in. If you want to put someone in two different roles (e.g. Power Reader and Data Source Manager) just add them twice.
There are four different roles available:
- Admin. (unsurprisingly) full rights over the server to build dashboards, administer security etc. Members of the (windows) administrator group on the Monitoring server are automatically put in this group.
- Data Source Manager. Create, delete and publish data sources on the monitoring server.
- Creator. Create any dashboard element (and delete any that they own – see below).
- Power Reader. Read-only access to everything.
- Finally, there is a further level to the security that allows you to assign any domain user to have rights to a particular dashboard element without them having to be members of any role on the server.
To do this open the element that you wish to amend the permissions for and select the Properties tab. At the bottom you’ll see a Permissions section. In here you can add any domain user as an editor or reader.

Don’t forget to click publish after you’ve changed the security for any dashboard element.
Happy Day of the Dead!!

Introduction to Data Wrangler in Microsoft Fabric
What is Data Wrangler? A key selling point of Microsoft Fabric is the Data Science
Jul
Autogen Power BI Model in Tabular Editor
In the realm of business intelligence, Power BI has emerged as a powerful tool for
Jul
Microsoft Healthcare Accelerator for Fabric
Microsoft released the Healthcare Data Solutions in Microsoft Fabric in Q1 2024. It was introduced
Jul
Unlock the Power of Colour: Make Your Power BI Reports Pop
Colour is a powerful visual tool that can enhance the appeal and readability of your
Jul
Python vs. PySpark: Navigating Data Analytics in Databricks – Part 2
Part 2: Exploring Advanced Functionalities in Databricks Welcome back to our Databricks journey! In this
May
GPT-4 with Vision vs Custom Vision in Anomaly Detection
Businesses today are generating data at an unprecedented rate. Automated processing of data is essential
May
Exploring DALL·E Capabilities
What is DALL·E? DALL·E is text-to-image generation system developed by OpenAI using deep learning methodologies.
May
Using Copilot Studio to Develop a HR Policy Bot
The next addition to Microsoft’s generative AI and large language model tools is Microsoft Copilot
Apr