Unless you’ve been living under a rock for the last week or so, you will have noticed that CTP2 for SQL Server 2016 has been released and is now available for download.I finally got round to downloading the CTP myself yesterday and my first port of call was to take a look at the new version of Master Data Services, as it’s been given a several improvements. Included in this list of improvements is a revamped front end, so I thought it would be worth making a start by exploring the front end improvements in this blog post.
New Look and Feel
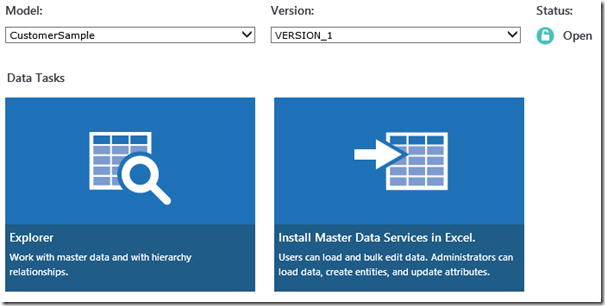
The first thing that you will notice is the new look and feel that will greet you in the web UI. Here’s the new look:

To recap – here’s the equivalent in SQL Server 2014 MDS:

The have been a few changes to the actual Explorer grid interface. One is that you now get a Copy Member button and also there is the ability to export your current view to an Excel MDS Add-In favourites file:

Another useful change is that on each entity you now get told who last updated the member and who created the member. In the previous version, MDS logged who last updated the member, but it wasn’t displayed to the end users. I’ve spoken to users who need this feature so its good to see it implemented:

Entity Dependencies
If you go into the Explorer, the main grid is still present and looks the same, but there are a few changes to the menu. There used to be a Explorer menu but this is now gone – after all you can get to the same thing via the other menus. There is a new Entity Dependencies menu, which will list all of the entities within the model, as you can see here:

After each entity is some brackets, which indicates the number of dependencies that the entity has. If you click on the entity (e.g. the Region entity), then you will get the opportunity on the Entity Dependencies view to drill down on an entity member in order to locate its dependencies at different levels:

Hierarchies and Collections
There have been some major changes to MDS hierarchies as covered on the MDS Team blog. In summary, Explicit Hierarchies and collections are now depreciated with the idea that they can be replaced with some of the new features of derived hierarchies. One such feature is the “Unused” node, which shows any members of the Derived Hierarchy that are missing a parent. E.g. in the example below I’ve created a new Area member, but its not been assigned a value for its Big Area attribute:

A small but useful change that I’ve noticed is that there is a setting for hierarchies that will auto-collapse a hierarchy branch if you expand a sibling branch:

For example, looking back at the screenshot I’ve included above, if North America was expanded, then turning this setting on would mean that that North America would collapse if I expanded the International branch of the hierarchy.
Summary
These UI improvements to the web interface make a welcomed change to a product that is now in its fourth SQL Server version. It’s great to see Microsoft investing in MDS, this will no doubt help increase the uptake of a product that (aside from in SQL 2014) has now seen steady improvement.
Introduction to Data Wrangler in Microsoft Fabric
What is Data Wrangler? A key selling point of Microsoft Fabric is the Data Science
Jul
Autogen Power BI Model in Tabular Editor
In the realm of business intelligence, Power BI has emerged as a powerful tool for
Jul
Microsoft Healthcare Accelerator for Fabric
Microsoft released the Healthcare Data Solutions in Microsoft Fabric in Q1 2024. It was introduced
Jul
Unlock the Power of Colour: Make Your Power BI Reports Pop
Colour is a powerful visual tool that can enhance the appeal and readability of your
Jul
Python vs. PySpark: Navigating Data Analytics in Databricks – Part 2
Part 2: Exploring Advanced Functionalities in Databricks Welcome back to our Databricks journey! In this
May
GPT-4 with Vision vs Custom Vision in Anomaly Detection
Businesses today are generating data at an unprecedented rate. Automated processing of data is essential
May
Exploring DALL·E Capabilities
What is DALL·E? DALL·E is text-to-image generation system developed by OpenAI using deep learning methodologies.
May
Using Copilot Studio to Develop a HR Policy Bot
The next addition to Microsoft’s generative AI and large language model tools is Microsoft Copilot
Apr