
Power BI Error: “The file is too large to be published. Power BI supports files up to 1024 MB”… Why is it not publishing? My Power BI file is way under 1 GB!
I find the above to be a very common scenario and regularly find myself having a conversation on how to find the genuine size of the Power BI file, once the data is processed and stored in memory. So with that said, let’s go ahead and put this to bed by exploring two ways to find the genuine size of our Power BI file and bust a very common myth.
Why is this important?
Before we jump into the details, it is important to understand why we should be able to derive the genuine memory usage of our Power BI files, hence the underlying dataset.
The first and the obvious reason is due to the 1 GB restriction we have when using and publishing Power BI items to the service through a Power BI Pro license. Exceeding the 1 GB will restrict us from publishing to the Power BI Service, therefore taking advantage of all the sharing and collaboration features.
Also, I find it very common for individuals to start the process of optimising their Power BI files by removing auto-generated data tables, unnecessary calculated columns, and memory-heavy transformations, etc. However, they do not take a snapshot of the current state beforehand, hence they don’t understand what changes are most effective to the performance increase of their solution. If you are experiencing any issues, be sure to check out my ‘Top 10 Power BI Performance Tips’ blog.
File Explorer shows the truth – MYTH
Okay, okay so file explorer does show us the truth, but only a part of the truth so it can be very misleading. Let’s take the below Power BI report as an example:
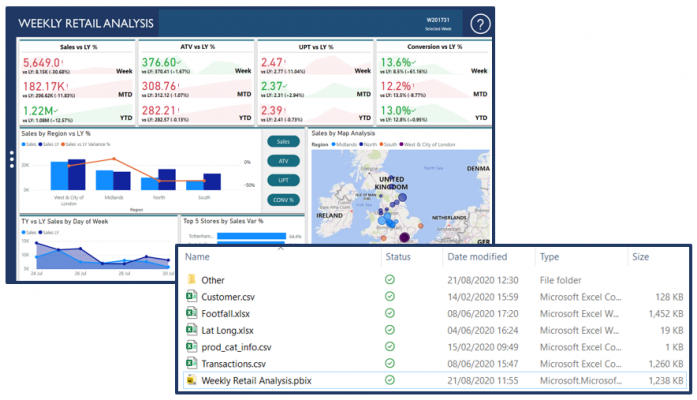
As you can see from the above screenshot, the size of the PBIX file is 1.2 MB (1,238 KB) by looking at the size in file explorer. Also, when we look at all the files we are ingesting into Power BI, the total size comes to 2.8 MB. However, when we ingest data into Power BI which is processed to memory, it can be bigger than the PBIX file size due to some compression that occurs and various other elements which again, are not displayed through the disk.
So, when we are getting various errors notifying us that our Power BI file is too large and we see that it is under the 1GB restriction on disk, it can leave us scratching our head. But, as I mentioned above due to compression and various other elements, once data is processed to memory it can be larger then what we see on disk, but still below the total size of the data source we are ingesting due to the compression.
Okay, Okay… So how do we see the true memory consumption?
We are going to look at two ways we can identify a good estimation of our memory consumption, which is through the VertiPaq Analyzer and DAX Studio. It’s worth noting, that you may come across various other ways for identifying the memory consumption of your Power BI file, such as working with task manager or establishing a connection to underlying Analysis Services instance from SQL Server Management Studio. But, I like to stick with the VertiPaq Analyzer and DAX Studio! Also,
VertiPaq Analyzer
The VertiPaq Analyzer is an Excel document that has a Power Pivot add-in which allows us to establish a connection to our Power BI model. Using this allows us to identify memory consumption, which objects are consuming most memory and also, gives us a consolidated view of other factors that make up the Power BI file, such as tables, columns, hierarchies, relationships, etc.
Once we open the VertiPaq Analyzer Excel document, and we establish a connection to the underlying Power BI Analysis Services instance through a set of queries, the below information will be retrieved and displayed:
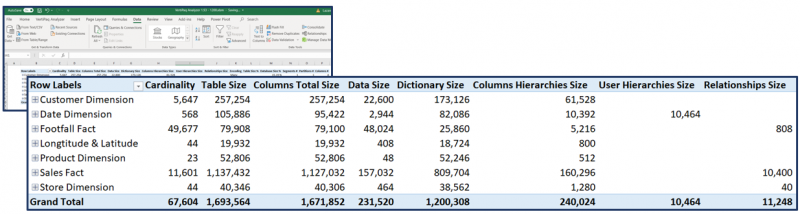
As you can see from the above screenshot, we have all the tables from our model displayed in the rows. We also have various metrics listed in the columns. We will not be exploring these in-depth, as the scope of this article is to only show the memory consumption.
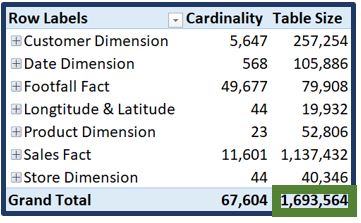
By looking at the below, the total size of the Power BI dataset for the Weekly Retail Analysis solution is 1.6 MB. This is identified by looking at the down total for the column ‘Table Size’:
So, we can see that we initially thought our Power BI dataset is 1.2 MB, bust instead it is 1.6 MB. The difference between what we see on disk and a more accurate view through the VertiPaq Analyzer is dependent on various elements. Below is a list of some of the metrics that offer us some insight into memory consumption:
- Table Size: the size of the table which is sum of all of the below – excl. Column Total Size
- Column Total Size: size of all structures relating to column
- Data Size: all the compressed data in partitions
- Dictionary Size: dictionary structures of unique values
- Columns Hierarchy Size: auto-generated hierarchies for columns
- User Hierarchy Size: user-defined hierarchies
- Relationship Size: relationships between tables
If you are wondering why the total ‘Table Size’ is different from the ‘Column Total Size’, this is due to some cases such as the relationships which are part of the table structure, but not the columns. So, the ‘Column Total Size’ is made up of the ‘Data Size’, ‘Dictionary Size’, and the ‘Hierarchy Size’. For this reason, to get a full view of the memory consumption we use the table over column size.
For more details on the underlying VertiPaq engine and the VertiPaq Analyzer, I would highlight recommend you explore the content over at SQLBI from both Alberto Ferrari and Marco Russo. Also, if you would like to learn more about the various types of compression, I always recommend reading The Definitive Guide to DAX.
DAX Studio
We can also use DAX Studio, a tool for writing, executing, and analysing DAX code, which assists us in optimising and debugging. Again, this is by establishing a connection to our Power BI model.
Previously, we would not be able to see the metrics that we have through the VertiPaq Analyzer in DAX Studio, however, we now have these available to us through the latest version of DAX Studio. Furthermore, we can now access DAX Studio directly through Power BI Desktop. Be sure to check External Tools if you haven’t already, it’s amazing! If you haven’t configured DAX Studio to display under External Tools, you can open up the tool directly through the application.
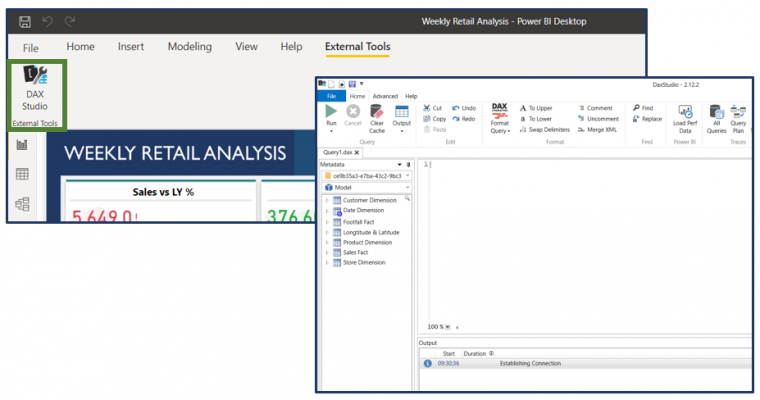
Now that we have DAX Studio open, we should go to the ‘Advanced’ tab and select ‘View Metrics’, to display the same metrics we had available to us in the VertiPaq Analyzer excel document.
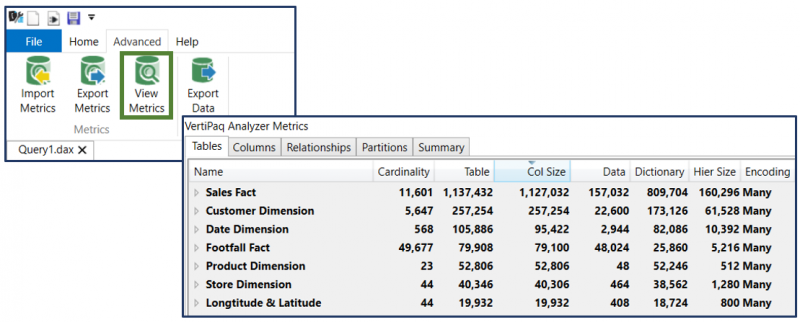
As you can see from the above screenshot, we again have all our tables from our model displayed in the rows and the metrics in the columns. Here we have the size for all the individual tables, which we can also expand to see more detail on the individual columns of these tables. But for now, we want to see the full size of our model. In the VertiPaq Analyzer in the excel document, we had the down total so we could easily identify that our Weekly Retail Analysis solution is 1.6 MB.
To do this here, we can simply select on the ‘Summary’ tab which will display the below information:
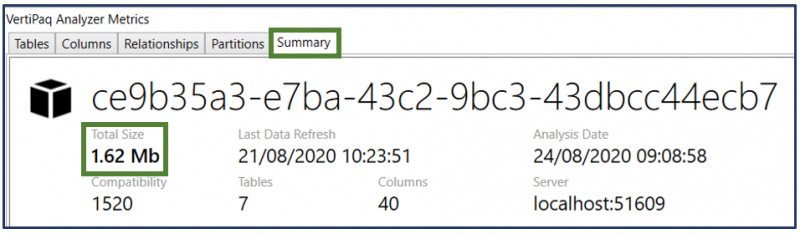
Once again, we can see that the total size of our Power BI solution is 1.6 MB. As I mentioned previously, these metrics were not always available in DAX Studio so when they were introduced, it was a great addition as you have all the core metrics in the tool you also use to optimise and debug your DAX code. We also can export these metrics and send them to individuals who may be able to understand the underlying numbers better.
Conclusion
When you next come across any issues or challenges that suggest you are exceeding the size limit, you should now be able to use either one of the above methods to get a solid understanding of your memory consumption. Simply taking the disk space of the Power BI file is not enough.
Introduction to Data Wrangler in Microsoft Fabric
What is Data Wrangler? A key selling point of Microsoft Fabric is the Data Science
Jul
Autogen Power BI Model in Tabular Editor
In the realm of business intelligence, Power BI has emerged as a powerful tool for
Jul
Microsoft Healthcare Accelerator for Fabric
Microsoft released the Healthcare Data Solutions in Microsoft Fabric in Q1 2024. It was introduced
Jul
Unlock the Power of Colour: Make Your Power BI Reports Pop
Colour is a powerful visual tool that can enhance the appeal and readability of your
Jul
Python vs. PySpark: Navigating Data Analytics in Databricks – Part 2
Part 2: Exploring Advanced Functionalities in Databricks Welcome back to our Databricks journey! In this
May
GPT-4 with Vision vs Custom Vision in Anomaly Detection
Businesses today are generating data at an unprecedented rate. Automated processing of data is essential
May
Exploring DALL·E Capabilities
What is DALL·E? DALL·E is text-to-image generation system developed by OpenAI using deep learning methodologies.
May
Using Copilot Studio to Develop a HR Policy Bot
The next addition to Microsoft’s generative AI and large language model tools is Microsoft Copilot
Apr