This blog is a high-level introduction to Graphframes, which is a package developed by Databricks for graph processing within apache spark.
This blog starts off with an introduction to graph before continuing to highlight Graphframes and how it’s different from GraphX. There will be another blog later whereby I run through an example using graphframes in databricks.
This blog is intended for someone looking at getting a simple overview of graph and graphframes. They are likely to have had some experience with spark and dataframes previously.
What is a graph data structure?
Data structures are a way of organizing, processing, retrieving and storing data. There are several basic and advanced structure types, all of which are designed to allow the user to arrange data in a specific way to suit a specific purpose.
In computer programming, choosing the right data structures are important for the purpose of using certain algorithms to help solve the problem in hand.
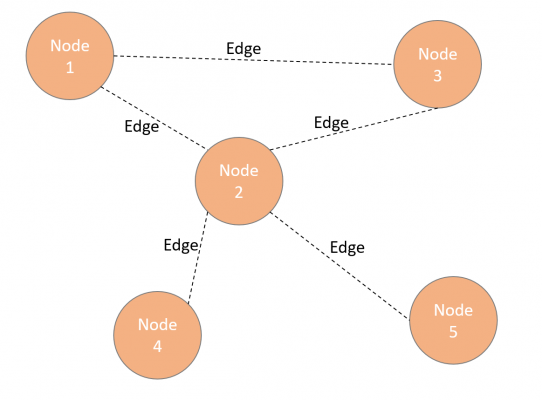
Graph is a common data structure that consists of a finite set of nodes and edges connecting those nodes. These edges (or connectors between nodes) can also be directional.
How is graph used?
The best example of a graph data structure is a social network, like Facebook or LinkedIn. Each node represents a person. That person (or node) will be connected to another person with that relationship better known as an edge. Each node can contain various bits of extra information like name, age and gender.
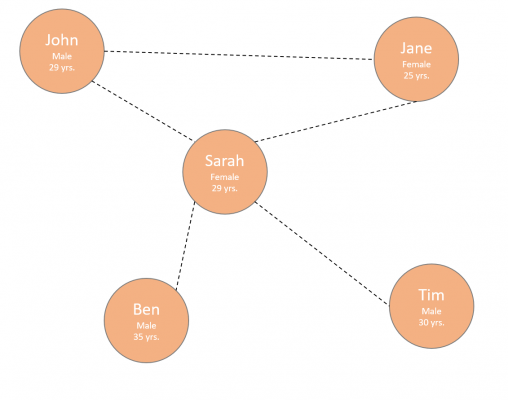
These nodes and edges combined create a network or using our example, a ‘social network’.
One of the ways we have used to view the data so far is through a visual representation of the data like our example above. There are three other common ways to summarize our graph data.
Edge lists.
This is simply a list (or an array) of each edge. Each edge is identified by the two people that create that relationship.
| Edge List |
| [John, Sarah] |
| [John, Jane] |
| [Sarah, Jane] |
| [Sarah, Ben] |
| [Sarah, Tim] |
Adjacency matrix.
Adjacency matrix is a matrix style view of each person’s relationship to one another.
| John | Sarah | Jane | Ben | Tim | |
| John | 0 | 1 | 1 | 0 | 0 |
| Sarah | 1 | 0 | 1 | 1 | 1 |
| Jane | 1 | 1 | 0 | 0 | 0 |
| Ben | 0 | 1 | 0 | 0 | 0 |
| Tim | 0 | 1 | 0 | 0 | 0 |
Adjacency lists.
Adjacency list is pretty much a combination of edge lists and adjacency matrix. For each person, store the person that there are adjacent to.
| John | -> | Sarah | Jane | ||
| Sarah | -> | John | Jane | Ben | Tim |
| Jane | -> | John | Sarah | ||
| Ben | -> | Sarah | |||
| Tim | -> | Sarah |
Quick analysis of the above summaries, you can see that Sarah is the most popular in this network.
Once you have your graph set up, you can run various algorithms designed to query your data. An example of one of these algorithms is “Shortest Path”. This algorithm finds the shortest path between nodes. There are several to choose from that work specifically with the way data is structured in graph.
Why graphs?
As I hope you can see, graph is a very powerful and versatile way to represent real life problems. It also helps that it can be a very visual way to represent data and its relationships.
Following on from the above example, I can see that John and Tim are not directly connected to each other, however John knows Sarah and Sarah knows Tim.
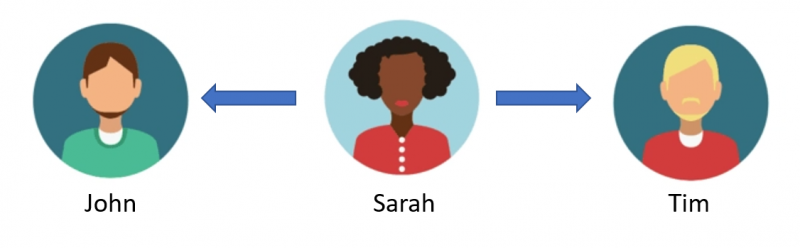
We could recommend Tim to John as a potential friend, knowing that they both know Sarah. Actually, could we run a query over the whole network and find friends that are one person away to recommend to people and therefore grow their network of friends?
This is actually what social networks like Facebook and LinkedIn do!
What are Graphframes?
Within the spark ecosystem, GraphX is the graph computational engine that sits on top of Spark core. What this means is, using Spark RDDs to store graph nodes and edges, you can use a number of graph algorithms to transform graph data. You have the benefits of distributed computing through spark and the low-level control of RDDs for graph parallel computation.
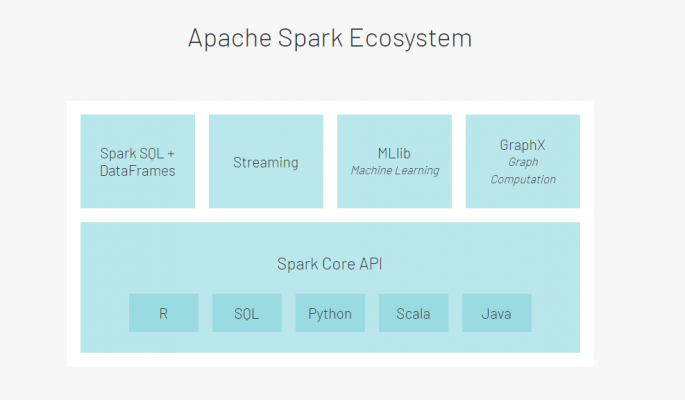
As implied in the naming, Graphframes is similar to Spark’s GraphX library but built upon Spark Dataframes. This totally changes how you interact with the underlying data. Nodes and Edges are represented in dataframes instead of RDDs. All of the sudden you have support for the more common spark APIs, like Python, Scala and Java. Capabilities also include more advance querying through Spark SQL. You can also save graphs in parquet, JSON and CSV.
Alongside all of this, you continue to have access to the GraphX libraries.
Just to be clear here, Graphframes is a graph processing package that is external to Spark and developed by Databricks and therefore may need to be loaded.
Let’s do a quick comparison between Graphframes and GraphX
| GraphFrames | GraphX | |
| Core APIs | Scala, Java, Python | Scala only |
| Programming Abstraction | DataFrames | RDDs |
| Use Cases | Algorithms, Queries, Motif Finding | Algorithms |
| Vertex/edge attributes | Any number of DataFrame columns | Any type |
| Return Types | GraphFrames/DataFrames | Graph |
Benefits of using Graphframes
- Access to python, scala and java API.
- Querying through SparkSQL
- Support for read/write many formats like parquet, JSON and csv.
- Access to the GraphX library
- Graph queries (common use would be motif finding found in genetics and biological sciences)
There are some differences in using GraphX vs Graphframes in terms of set up and GraphX has been around longer than Graphframes, but the flexibility of Graphframes is likely to be the main benefit here.
What next?
My next installment will be to run through an example, so stay tuned!
Introduction to Data Wrangler in Microsoft Fabric
What is Data Wrangler? A key selling point of Microsoft Fabric is the Data Science
Jul
Autogen Power BI Model in Tabular Editor
In the realm of business intelligence, Power BI has emerged as a powerful tool for
Jul
Microsoft Healthcare Accelerator for Fabric
Microsoft released the Healthcare Data Solutions in Microsoft Fabric in Q1 2024. It was introduced
Jul
Unlock the Power of Colour: Make Your Power BI Reports Pop
Colour is a powerful visual tool that can enhance the appeal and readability of your
Jul
Python vs. PySpark: Navigating Data Analytics in Databricks – Part 2
Part 2: Exploring Advanced Functionalities in Databricks Welcome back to our Databricks journey! In this
May
GPT-4 with Vision vs Custom Vision in Anomaly Detection
Businesses today are generating data at an unprecedented rate. Automated processing of data is essential
May
Exploring DALL·E Capabilities
What is DALL·E? DALL·E is text-to-image generation system developed by OpenAI using deep learning methodologies.
May
Using Copilot Studio to Develop a HR Policy Bot
The next addition to Microsoft’s generative AI and large language model tools is Microsoft Copilot
Apr