Calculated Tables have been around for a while in Power BI, but today I found a real life scenario for using them. I connected to Manchester United’s Facebook page and plugged the data into Microsoft’s Cognitive Services. In essence, I want to measure Sentiment Analysis and find out how many times a supporter has mentioned one of Manchester United’s rival football teams.
You are probably wondering what this has to do with a DAX Calculated Table, so let me explain. I have pulled down the Facebook data (from the API), but when trying to undertake a GROUP BY for Likes, Loves, etc. in the Query Editor, Power BI hangs and the query never resolves. Whilst I cannot pinpoint exactly why this happens, I would guess that the number of API calls to Facebook are exceeded and some form of timeout occurs.
This blog will walk you through how to create a DAX Calculated Table and apply a Group By to get the count of reaction types. There are a number of articles already out there showing examples of a Calculated Table and I have provided the links at the bottom of the post.
Existing Query
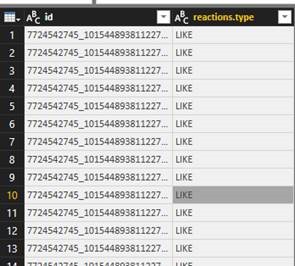
Currently, my query looks like the below:
The only remaining task is to apply a COUNT of all records, GROUPED BY Reactions.Type and id. If I try and use the Query Editor functionality within the UI, the transformation step never completes. I am left with the following message in bottom right hnd side of the Query Editor:
After waiting two hours for the GROUP BY query to resolve, I gave up. The alternative is to use a DAX Calculated Table and I will show you how I achieved this:
Calculated Table
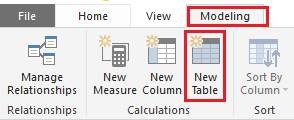
In order to create A Calculated Table, come out of the Query Editor, navigate to the Modeling tab and select New Table.
Now we can write some DAX. Pasting the below syntax into the new Table will achieve the Group By on the ‘Reaction Man United’ query.
ReactionTotalsManUnited = GROUPBY (
ReactionsManUnited, ReactionsManUnited[id], ReactionsManUnited[reactions.type], “TotalReactions”, COUNTX( CURRENTGROUP(), ReactionsManUnited[reactions.type])
)
Let me break down the code:
o Calculated Table named as ‘ReactionTotalsManUnited’
o GROUP BY function, grouping all reaction Id’s (‘id’) and types (‘reactions.type’)
o COUNTX function applied over reaction type, using the CURRENTGROUP() function to ensure the unique count is made by Id and Type within the ‘ReactionsManUnited’ table.
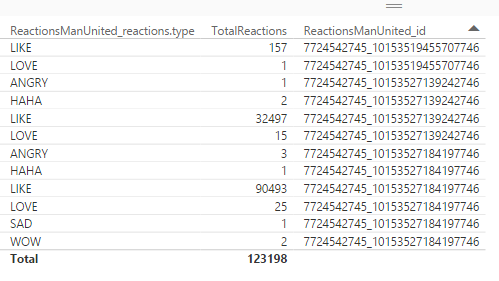
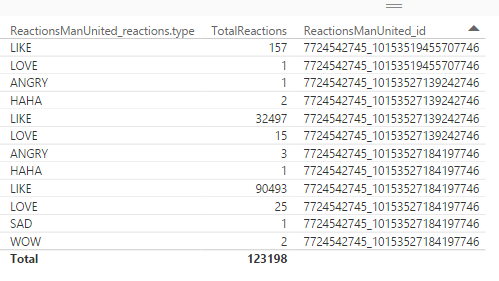
Finally, to test the new DAX table works, I have created a basic KPI Card. It is aggregating exactly expected.
Conclusion
Let’s recap. I have shown you how to use three DAX expressions, albeit nested together in one statement. This demonstrates how powerful and flexible the language is.
o GROUP BY
o COUNTX
I made use of the Calculate Table functionality due to poor performing queries made to the Facebook API. There are many other reasons for using them, with some good examples provided in Chris Webb’s blog.
Where possible, you should always use Query Editor (and M language) for ad hoc transformations, although a DAX expression can sometimes get around slow performing queries. DAX measures are evaluated at run time and in memory, whereas the Query Editor needs to pull down and refresh data after every applied step.
I would strongly recommend that all budding Power BI developers learn DAX, in order to get the most out of your Power BI reports. The Calculated Table function is just one of over 200 different expressions within Power BI.
Further Reading
o Microsoft MSDN – http://bit.ly/2l34vsW
o Power BI Blog – http://bit.ly/2lBWRJc
o Reza Rad’s Blog – http://bit.ly/2lBKjkW
o Chris Webb’s blog – http://bit.ly/2m3IDlg
o List of DAX Expressions (Paul Turley’s blog) – http://bit.ly/2mfBZ8y
Contact Me
If you would like a copy of the workbook or have any questions about this blog, please leave a comment below or contact me on Twitter (@DataVizWhizz ).


Introduction to Data Wrangler in Microsoft Fabric
What is Data Wrangler? A key selling point of Microsoft Fabric is the Data Science
Jul
Autogen Power BI Model in Tabular Editor
In the realm of business intelligence, Power BI has emerged as a powerful tool for
Jul
Microsoft Healthcare Accelerator for Fabric
Microsoft released the Healthcare Data Solutions in Microsoft Fabric in Q1 2024. It was introduced
Jul
Unlock the Power of Colour: Make Your Power BI Reports Pop
Colour is a powerful visual tool that can enhance the appeal and readability of your
Jul
Python vs. PySpark: Navigating Data Analytics in Databricks – Part 2
Part 2: Exploring Advanced Functionalities in Databricks Welcome back to our Databricks journey! In this
May
GPT-4 with Vision vs Custom Vision in Anomaly Detection
Businesses today are generating data at an unprecedented rate. Automated processing of data is essential
May
Exploring DALL·E Capabilities
What is DALL·E? DALL·E is text-to-image generation system developed by OpenAI using deep learning methodologies.
May
Using Copilot Studio to Develop a HR Policy Bot
The next addition to Microsoft’s generative AI and large language model tools is Microsoft Copilot
Apr