Analysis Services tabular models can have hundreds of base DAX measures, duplications of code, and syntax. However, with the new world of DAX Calculation groups we can re-use calculations and apply them to virtually any measure.
Within analysis services, DAX Calculation Groups give the user the ability to apply multi-use calculations to measures. This feature is available on Analysis Services in SQL Server 2019 2.3 and should be available in the SQL Server 2019 release. Currently, calculation groups can only be created with the Tabular Editor UI.
The first, and most prominent example of this is time intelligence and the application of MTD (Month to Date), YTD (Year to Date), and QTD (Quarter to Date) calculations. By reducing the number of measures, with calculation groups we can present a clearer user interface to the users.
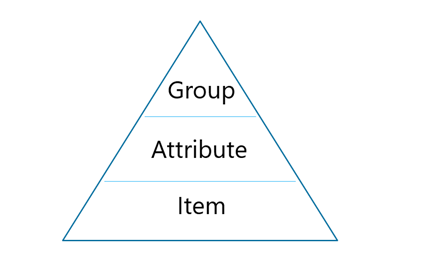
Below are two images that show the calculation group hierarchy. The hierarchy is used to call a calculation on a measure.


The calculation group is called calculation group, the attribute is called time, and the item is called MTD.
The calculation items use the new ‘SelectedMeasure’ function. When called ‘SelectedMeasure’ will replace the measure that you have selected for calculation.
CALCULATE(SELECTEDMEASURE(), DATESMTD(DimDate[Date]))

CALCULATE(SELECTEDMEASURE(), DATESYTD(DimDate[Date]))

CALCULATE(SELECTEDMEASURE(), DATESQTD(DimDate[Date]))
The script below calculates the measure ‘InternetTotalSales’ upon the calculation items; ‘Current’, ‘QTD’, ‘YTD’ etc.
EVALUATE
CALCULATETABLE (
SUMMARIZECOLUMNS (
DimDate[CalendarYear],
DimDate[EnglishMonthName],
"Current", CALCULATE ( [InternetTotalSales], 'CalculationGroup'[Time] = "Current" ),
"QTD",     CALCULATE ( [InternetTotalSales], 'CalculationGroup'[Time] = "QTD" ),
"YTD",     CALCULATE ( [InternetTotalSales], 'CalculationGroup'[Time] = "YTD" ),
"PY",      CALCULATE ( [InternetTotalSales], 'CalculationGroup'[Time] = "PY" ),
"PY QTD",  CALCULATE ( [InternetTotalSales], 'CalculationGroup'[Time] = "PY QTD" ),
"PY YTD",  CALCULATE ( [InternetTotalSales], 'CalculationGroup'[Time] = "PY YTD" )
),
DimDate[CalendarYear] IN { 2012, 2013 }
And, when we run this script we get the following table:

Looking forward, we should see this eventually in PowerBI, SQL Server Data tools, and Azure Analysis Services. So, watch this space. Read more from Microsoft here
Throughout this year, you will see more blogs and guides from me on this topic as it unfolds.
GPT-4 with Vision vs Custom Vision in Anomaly Detection
Businesses today are generating data at an unprecedented rate. Automated processing of data is essential
May
Exploring DALL·E Capabilities
What is DALL·E? DALL·E is text-to-image generation system developed by OpenAI using deep learning methodologies.
May
Using Copilot Studio to Develop a HR Policy Bot
The next addition to Microsoft’s generative AI and large language model tools is Microsoft Copilot
Apr
Pretty Power BI – Adding GIFs
Good UX design is critical in enabling stakeholders to maximise the key insight that they
Apr
Pareto Charts in Power BI and the DAX behind them
The Pareto principle, commonly referred to as the 80/20 rule, is a concept of prioritisation.
Apr
Databricks: Cluster Configuration
Databricks, a cloud-based platform for data engineering, offers several tools that can be used to
Apr
AI Assistance in Microsoft Fabric
The exponential growth of Large Language Models (LLMs) couples with Microsoft’s close partnership with OpenAI
Apr
10 reasons why it’s worth the effort to understand the value of your data
“If leaders really want to create a data driven culture, the journey starts with them!
Apr