Ever had to do statistical analysis on data in sql server? Maybe for reporting or to generate some data for things such as KPI’s in SSAS for example. One aspect of doing data analysis I found interesting and challenging in equal measure is percentiles. What is a percentile I hear you ask? (if you know what a percentile is just skip past this bit)
Well imagine you and 99 other people take a test and that the test is scored numerically. Now generally people being people would like to know how many of their follow exam takers they’ve beaten in the exam (I know I would ![]() ). So in our example if you’ve done pretty well and say scored better than 80 of your fellow 99 exam takers, then you would be better than 80% of them and hence you would be in the 80th percentile. This of course is a very simplistic example but you get the idea.
). So in our example if you’ve done pretty well and say scored better than 80 of your fellow 99 exam takers, then you would be better than 80% of them and hence you would be in the 80th percentile. This of course is a very simplistic example but you get the idea.
Personally I feel this is more of a common thing in every day life in the America for example than it is here in the UK but it does crop up a lot in reporting and KPI’s for example.
Which way!?
Now in my mind there are two quite distinct “directions” you can take in calculating percentiles. The first is the same as in the example above, you take a score, compare it to the rest of its set or “pot” and work out it’s individual position. The second is where you have a set of percentile “milestones” you wish to calculate (5th, 25th, 50th, 75th and 95th for example), then for each set or “pot” of data you have, you find the value within that pot that is the closest to each of your milestones.
NB: If you try and do something like this in excel, its worth noting that the PERCENTILE function in excel will actually fabricate a figure that is mathematically exact to the percentile you ask for based on the pot of data its given. Although technically the this is more numerically accurate, in my opinion in 99.9% of cases this is overkill, simply because if you calculate percentile milestones from a pot of data, you should only ever compare values from that pot to those milestones, making the additional effort to calculate the precise value rather than finding the closest actual value pointless. My preferred method is to select an actual value from the set that is closest to each of the required milestones.
Each “direction” has its own merits and down points, but I think the decision all boils down to volume, purpose and required accuracy. So using my exam example from earlier, imagine if 100 million people took that test, now think of the follow set of possible scenarios
- You want to generate and send each person an individualised result sheet, unless you had to in order to give each person their exact percentile, would you really want to run that calculation 100 million times? Probably not, what’s more likely is that you’d take the milestone approach, even if you set 100 milestones (1 per percentile), it would be cheaper to calculate these first and then compare each value to the mile stones to get roughly their percentile
- You allow the test takers to login to a website and see a personalised score sheet and lets say you know that around only 10% of the test takers will login and do this. In this case it would probably be best to generate each individual score as its requested from the website.
Ultimately the choice is up to you but I’d say the milestone approach generally covers more bases, so that will be the focus for this post from here on in.
A worked example
So before we dive into the sql I wanted to run though how this works logically. I feel this will make the sql easier to follow as you can concentrate on how the code is working rather than its doing, if that makes sense.
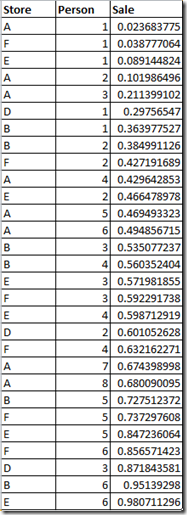
So lets take our demo data pot below
This is a fictitious set of sales figures by store and sales person, each person value is unique within a store and each unique person has one row each (imagine this is a monthly totals of sales for example).
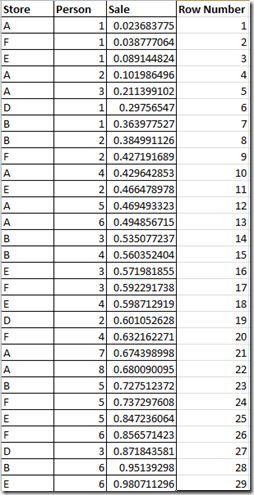
So the first thing that needs to happen is the data needs to be sorted, smallest to largest. As you can see I have already done this. The next step is to give each row a position or row number, based on its now sorted location in the pot (see below)
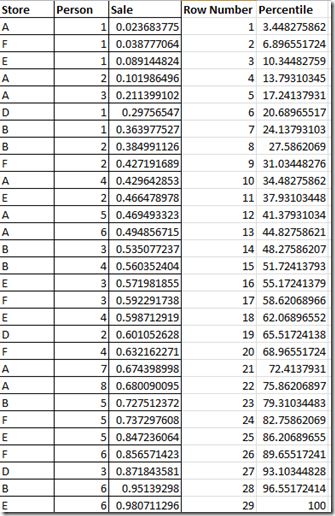
Then for each row we need to work out it’s percentile in relation to the pot, we do this simply by dividing 100 by the number of rows in the pot (29 in our case), then multiplying the the resulting figure by that rows, row number. So the calc would look something like this: (100/Recs In Pot) * Row Number
This then gives us each records percentile value relative to its pot (see below):
Now we’ve got the percentile figure for every row what we need to do is evaluate each rows suitability to represent each one of our milestones. In this example I’ll be using 5th, 25th, 50th, 75th and 95th percentiles as my required milestones.
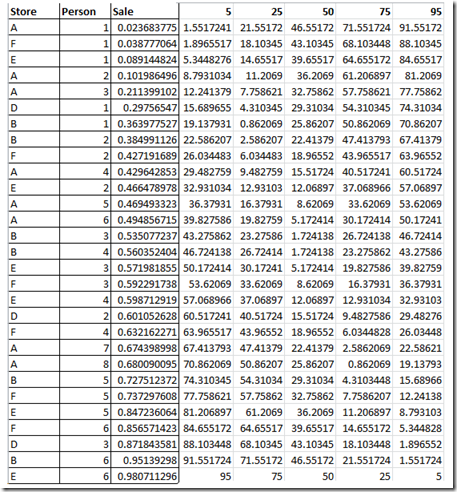
So to determine the each rows suitability to represent each milestone, we do a calculation per required milestone, subtracting the rows percentile value from the required milestone getting the “absolute” value back (This is a mathematical term, basically what it does is ensure you always return a positive figure). This then gives us a, for each rows percentile value, a “distance” from each milestone. The calculation for the 5th percentile would look something like this: ABS(Row Percentile – 5)
See the below for the results for these calculations for our demo data pot:
What this leaves us with is a list of candidate values for each of our milestones. From here it is simply a matter of getting the row with the minimum distance value for each of our milestones (Hence numerically the closest, in either direction, to the percentile milestone). That rows value (sale value, not percentile value) then becomes the value for that given milestone.
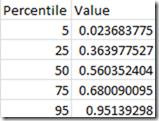
This leaves us with a very tidy table as below:
Then all you need to do in your report or wherever you need to know which percentile bracket your row falls in to is to simply compare the rows value to the above percentile table. so to see of your row is in the 25th to 50th percentile range you’d do something like: If My Row Value >= Percentile25Value and <= Percentile50Value then ……
All make sense?? good! ![]()
To the code!
So by now hopefully you understand logically how this should work so lets see how to do in sql server!
Ok first of all we need to establish our data set, in this example I am using the adventure works database and working with the [Sales].[SalesOrderDetail] and [Sales].[SalesOrderHeader] tables. I’m using CTE’s here because that’s my style, there are a few ways you can do this, but this is my preferred way. As with all my posts I always say this may not be the out and out best way or maybe it is, but it works for me and works well.
The first part of the code looks like this:
;with SalesDetail as
(
    SELECT  OrderYear, SalesPersonID, LineTotal, (100.00 / RecsInPot) * PositionInPot as Percentile
    FROM
    (
        SELECT year(SOH.OrderDate) as OrderYear, SOH.SalesPersonID, SOD.LineTotal
            ,count(*) over (partition by year(OrderDate), SalesPersonID) as RecsInPot
            ,row_number() over (partition by year(OrderDate), SalesPersonID order by LineTotal) as PositionInPot
        FROM Sales.SalesOrderDetail as SOD
        JOIN Sales.SalesOrderHeader as SOH on SOD.SalesOrderID = SOH.SalesOrderID
        where SOH.SalesPersonID is not null
    ) as T
)
This example varies slightly from the logically worked example above in that this dataset has many “pots” of data within it. In this instance a pot is defined by the OrderYear (which is the year from the SalesOrderHeader OrderDate column) and the SalesPersonID. When we’re done we will be able to see how each sale in each year ranked against all other sales that year with the inclusion of which sales person made the sale. i.e. sales person 123 made a sale of XYZ in 2009, how did that sale compare to all other sales by all other sales people that year.
As in the logical example we take the data, count the number or records per pot (RecsInPot) and then rank the rows in each pot from lowest to highest based on the value of the sale (PositionInPot). From these figures we then work out each rows percentile figure (Percentile).
Then for the next phase we add a second CTE based on the results of the first CTE as below:
Candidates as
(
    SELECT  OrderYear, SalesPersonID, LineTotal
        ,abs(Percentile - 5) as PT5_Candidate
        ,abs(Percentile - 25) as PT25_Candidate
        ,abs(Percentile - 50) as PT50_Candidate
        ,abs(Percentile - 75) as PT75_Candidate
        ,abs(Percentile - 95) as PT95_Candidate
    FROM SalesDetail as SD
)
As you can see I have named this CTE “Candidates” and if you’ll remember back to the logical example earlier this is doing exactly the same thing, assessing the suitability each LineTotals value to represent each of the required milestones (I’m using 5,25,50,75 and 95 here but obviously these can be any values you like)
Next we expand the code further, adding a third CTE called Targets
Targets as
(
    SELECT OrderYear, SalesPersonID
        ,min(abs(Percentile - 5)) as PT5_Target
        ,min(abs(Percentile - 25)) as PT25_Target
        ,min(abs(Percentile - 50)) as PT50_Target
        ,min(abs(Percentile - 75)) as PT75_Target
        ,min(abs(Percentile - 95)) as PT95_Target
    FROM SalesDetail as SD
    GROUP BY OrderYear, SalesPersonID
)
As it says on the tin the “Targets” CTE then works out, for each milestone, the smallest percentile distance from the available set available. After this is just a matter of matching up the targets with the candidates which will then give us the value for each milestone. To do this we add the follow final bit to the code:
SELECT  OrderYear, SalesPersonID
    ,[Percentile5]
    ,[Percentile25]
    ,[Percentile50]
    ,[Percentile75]
    ,[Percentile95]
FROM
(
    SELECT C.OrderYear, C.SalesPersonID, C.LineTotal,
        (
        case
            when PT95_Candidate = PT95_Target then 'Percentile95'
            when PT75_Candidate = PT75_Target then 'Percentile75'
            when PT50_Candidate = PT50_Target then 'Percentile50'
            when PT25_Candidate = PT25_Target then 'Percentile25'
            when PT5_Candidate = PT5_Target then 'Percentile5'
        end
        ) as Percentile
    FROM Candidates as C
    JOIN Targets as T on
        T.OrderYear = C.OrderYear
        and T.SalesPersonID = C.SalesPersonID
        and
        (
            PT5_Candidate = PT5_Target
            or
            PT25_Candidate = PT25_Target
            or
            PT50_Candidate = PT50_Target
            or
            PT75_Candidate = PT75_Target
            or
            PT95_Candidate = PT95_Target
        )
) as T
pivot (max(T.LineTotal) for Percentile in ([Percentile5],[Percentile25],[Percentile50],[Percentile75],[Percentile95])) as pvt
What we’re doing here is pretty straight forward, we select from the Candidates CTE, joining onto the Targets CTE where they match on order year, sales person and if any of their candidate values match onto one of the targets thus making that rows sales value the value that will represent the matched milestone. We are then pivoting each of the percentile values up to make one row per “pot” which can then be easily joined onto the data later on in reports etc to find a given percentile range for each value.
Finishing up
So the whole of the code looks like this
;with SalesDetail as
(
    SELECT  OrderYear, SalesPersonID, LineTotal, (100.00 / RecsInPot) * PositionInPot as Percentile
    FROM
    (
        SELECT year(SOH.OrderDate) as OrderYear, SOH.SalesPersonID, SOD.LineTotal
            ,count(*) over (partition by year(OrderDate), SalesPersonID) as RecsInPot
            ,row_number() over (partition by year(OrderDate), SalesPersonID order by LineTotal) as PositionInPot
        FROM Sales.SalesOrderDetail as SOD
        JOIN Sales.SalesOrderHeader as SOH on SOD.SalesOrderID = SOH.SalesOrderID
        where SOH.SalesPersonID is not null
    ) as T
),

Candidates as
(
    SELECT  OrderYear, SalesPersonID, LineTotal
        ,abs(Percentile - 5) as PT5_Candidate
        ,abs(Percentile - 25) as PT25_Candidate
        ,abs(Percentile - 50) as PT50_Candidate
        ,abs(Percentile - 75) as PT75_Candidate
        ,abs(Percentile - 95) as PT95_Candidate
    FROM SalesDetail as SD
),

Targets as
(
    SELECT OrderYear, SalesPersonID
        ,min(abs(Percentile - 5)) as PT5_Target
        ,min(abs(Percentile - 25)) as PT25_Target
        ,min(abs(Percentile - 50)) as PT50_Target
        ,min(abs(Percentile - 75)) as PT75_Target
        ,min(abs(Percentile - 95)) as PT95_Target
    FROM SalesDetail as SD
    GROUP BY OrderYear, SalesPersonID
)


SELECT  OrderYear, SalesPersonID
    ,[Percentile5]
    ,[Percentile25]
    ,[Percentile50]
    ,[Percentile75]
    ,[Percentile95]
FROM
(
    SELECT C.OrderYear, C.SalesPersonID, C.LineTotal,
        (
        case
            when PT95_Candidate = PT95_Target then 'Percentile95'
            when PT75_Candidate = PT75_Target then 'Percentile75'
            when PT50_Candidate = PT50_Target then 'Percentile50'
            when PT25_Candidate = PT25_Target then 'Percentile25'
            when PT5_Candidate = PT5_Target then 'Percentile5'
        end
        ) as Percentile
    FROM Candidates as C
    JOIN Targets as T on
        T.OrderYear = C.OrderYear
        and T.SalesPersonID = C.SalesPersonID
        and
        (
            PT5_Candidate = PT5_Target
            or
            PT25_Candidate = PT25_Target
            or
            PT50_Candidate = PT50_Target
            or
            PT75_Candidate = PT75_Target
            or
            PT95_Candidate = PT95_Target
        )
) as T
pivot (max(T.LineTotal) for Percentile in ([Percentile5],[Percentile25],[Percentile50],[Percentile75],[Percentile95])) as pvt
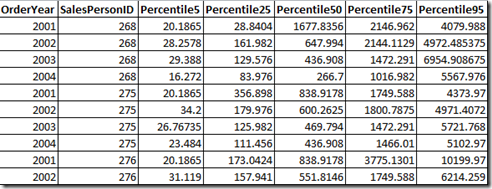
For reference the resulting output looks like the below. I’m only showing the top 10 here but run the code for yourself against adventure works to get the full set
As you can see this is a small, lightweight reference table that can easily be used to find were a value would fall.
Now that’s about it, apart from a quick note to say if you want to test this yourself I’ve actually added a couple of indexes as below, just to support the query, they aren’t essential but they do make enough of a difference to put them on
create nonclustered index [IX_SalesOrderHeader_SalesPersonID_Inc] on [Sales].[SalesOrderHeader]
([SalesPersonID] asc)
include (SalesOrderID, OrderDate)
GO


create nonclustered index idx_SalesOrderDetail_SalesOrder_inc on Sales.SalesOrderDetail
(SalesOrderID)
include (OrderQty, UnitPrice, UnitPriceDiscount)
And that’s it, thanks for sticking with it, I know its been a long one and I hope you’ve learnt something


Introduction to Data Wrangler in Microsoft Fabric
What is Data Wrangler? A key selling point of Microsoft Fabric is the Data Science
Jul
Autogen Power BI Model in Tabular Editor
In the realm of business intelligence, Power BI has emerged as a powerful tool for
Jul
Microsoft Healthcare Accelerator for Fabric
Microsoft released the Healthcare Data Solutions in Microsoft Fabric in Q1 2024. It was introduced
Jul
Unlock the Power of Colour: Make Your Power BI Reports Pop
Colour is a powerful visual tool that can enhance the appeal and readability of your
Jul
Python vs. PySpark: Navigating Data Analytics in Databricks – Part 2
Part 2: Exploring Advanced Functionalities in Databricks Welcome back to our Databricks journey! In this
May
GPT-4 with Vision vs Custom Vision in Anomaly Detection
Businesses today are generating data at an unprecedented rate. Automated processing of data is essential
May
Exploring DALL·E Capabilities
What is DALL·E? DALL·E is text-to-image generation system developed by OpenAI using deep learning methodologies.
May
Using Copilot Studio to Develop a HR Policy Bot
The next addition to Microsoft’s generative AI and large language model tools is Microsoft Copilot
Apr